10 Best Trading Chart Pattern Examples for 2025
On this page
In 2025’s fast-moving markets, the ability to quickly spot a trading chart pattern can make all the difference for active traders.
Understanding these patterns helps you forecast price movements across forex, stocks, and crypto, giving you a clear edge when every second counts.
By mastering trading chart pattern recognition, you can boost your profits and lower your risk, even as markets become more unpredictable.
In this article, we’ll break down the 10 best trading chart pattern examples for 2025, showing you exactly how they work and how to use them for smarter trading decisions.
What Are Trading Chart Patterns and Why Do They Matter in 2025?
Trading chart pattern recognition is a foundational skill for modern traders. At its core, a trading chart pattern is a recurring formation that appears on price charts, signaling where the market might head next. These patterns are visual footprints of market psychology, reflecting collective decisions from millions of participants. Despite advances in algorithmic trading, the human emotions, fear, greed, optimism, embedded in price action continue to create these recognizable shapes.
Patterns like triangles, flags, and head & shoulders tell a story about buyers and sellers. For example, a head & shoulders pattern often signals a potential reversal, as bullish momentum wanes and sellers take control. In contrast, continuation patterns, such as pennants or flags, suggest the prevailing trend is likely to resume after a brief pause. Understanding the difference between reversal and continuation formations helps traders align their strategies with the current market environment, whether they’re seeking to catch turning points or ride ongoing trends.
In 2025, the ability to read a trading chart pattern is more crucial than ever. Markets have become faster and more volatile, driven by adaptive algorithms and global news cycles. This heightened pace means that pattern recognition can offer a valuable edge, especially when combined with real-time analysis tools. According to industry studies, classic patterns like triangles and head & shoulders remain among the most reliable, delivering robust statistical win rates across forex, stocks, and crypto. For those eager to explore a wide range of formations, the Chart Patterns Category provides a comprehensive resource.
Consider a real-world example: A forex trader spots an ascending triangle forming on the EUR/USD daily chart. By identifying the pattern early, confirming it with increased volume, and setting a strategic stop-loss, the trader captures a breakout move, turning a well-timed analysis into tangible profit. However, no trading chart pattern is infallible. False signals and failed breakouts happen, especially in choppy markets. That’s why risk management, using stops, position sizing, and confirmation from other tools, is essential to long-term success.
Trading chart pattern analysis works for both day traders and swing traders. Short-term traders benefit from quick pattern formations on intraday charts, while longer-term investors use weekly or daily patterns to catch major shifts. Yet, it’s vital to remember that patterns are just one part of the trading puzzle. Combining them with sound risk management and a disciplined mindset is the best way to navigate the ever-evolving markets of 2025.

How to Identify and Trade Chart Patterns Effectively
Mastering the art of identifying and trading chart patterns is essential for navigating today’s dynamic markets. If you want to consistently spot profitable opportunities, you need a systematic approach to trading chart pattern recognition. Let’s break down the process into actionable steps, highlight the best tools, and share key strategies to boost your chart pattern success.

Spotting Trading Chart Patterns: Key Steps
Start by identifying the overall trend, bullish, bearish, or sideways. Draw support and resistance lines to frame the price action. Next, look for recognizable trading chart pattern shapes, such as triangles or double tops, within these zones.
Volume is a crucial confirmation tool. Patterns accompanied by rising volume during breakouts are generally more reliable. Remember, pattern recognition is part art, part science; practice by reviewing historical charts and marking out patterns you find.
Tools & Platforms for Pattern Recognition
Modern trading platforms like TradingView and MetaTrader offer advanced charting features that make it easier to spot trading chart pattern formations. These platforms allow you to overlay indicators, draw trendlines, and even use AI-based pattern recognition plugins.
The timeframe you choose, whether intraday, daily, or weekly, affects the reliability of patterns. For instance, patterns on higher timeframes tend to be more robust, while intraday charts may produce more false signals. To deepen your pattern analysis, consider incorporating Multi Timeframe Analysis to validate setups across different chart views.
Here’s a quick comparison:
| Timeframe | Reliability | Use Case |
|---|---|---|
| Intraday | Moderate | Day trading |
| Daily | High | Swing trading |
| Weekly | Very High | Position trading |
Best Practices and Common Pitfalls
Enhance your trading chart pattern accuracy by combining patterns with technical indicators like RSI or moving averages. This double confirmation filters out weak signals.
Best practices:
- Wait for clear pattern completion before entering trades.
- Confirm with volume and at least one indicator.
- Always set stop-loss levels based on pattern structure.
Common pitfalls to avoid:
- Overfitting: Seeing patterns where none exist.
- Confirmation bias: Ignoring evidence that contradicts your setup.
- Trading patterns in isolation without broader market context.
Backtesting your approach using historical data helps you understand the statistical edge of each trading chart pattern. This process builds confidence and refines your strategy.
Adaptive Recognition & Real-World Example
In 2025, adaptive tools are revolutionizing trading chart pattern detection. Automated scanners can alert you to emerging setups in real time, saving hours of manual analysis.
Consider a mini-case study: A trader misidentified a descending triangle and entered a trade early, resulting in a loss. Later, by leveraging AI-based pattern recognition and confirming with volume and RSI, they correctly identified a head and shoulders. This led to a profitable short trade, illustrating the value of combining technology with disciplined analysis.
Ultimately, mastering trading chart pattern identification is about blending proven techniques with new technologies, always backed by sound risk management.
10 Best Trading Chart Pattern Examples for 2025
Ready to level up your trading strategy for 2025? Mastering the right trading chart pattern can unlock smarter entries, tighter stops, and bigger wins. Below, we break down the 10 most powerful chart patterns, what they look like, how to trade them, and why they still matter in today’s volatile, AI-driven markets.
1. Head and Shoulders
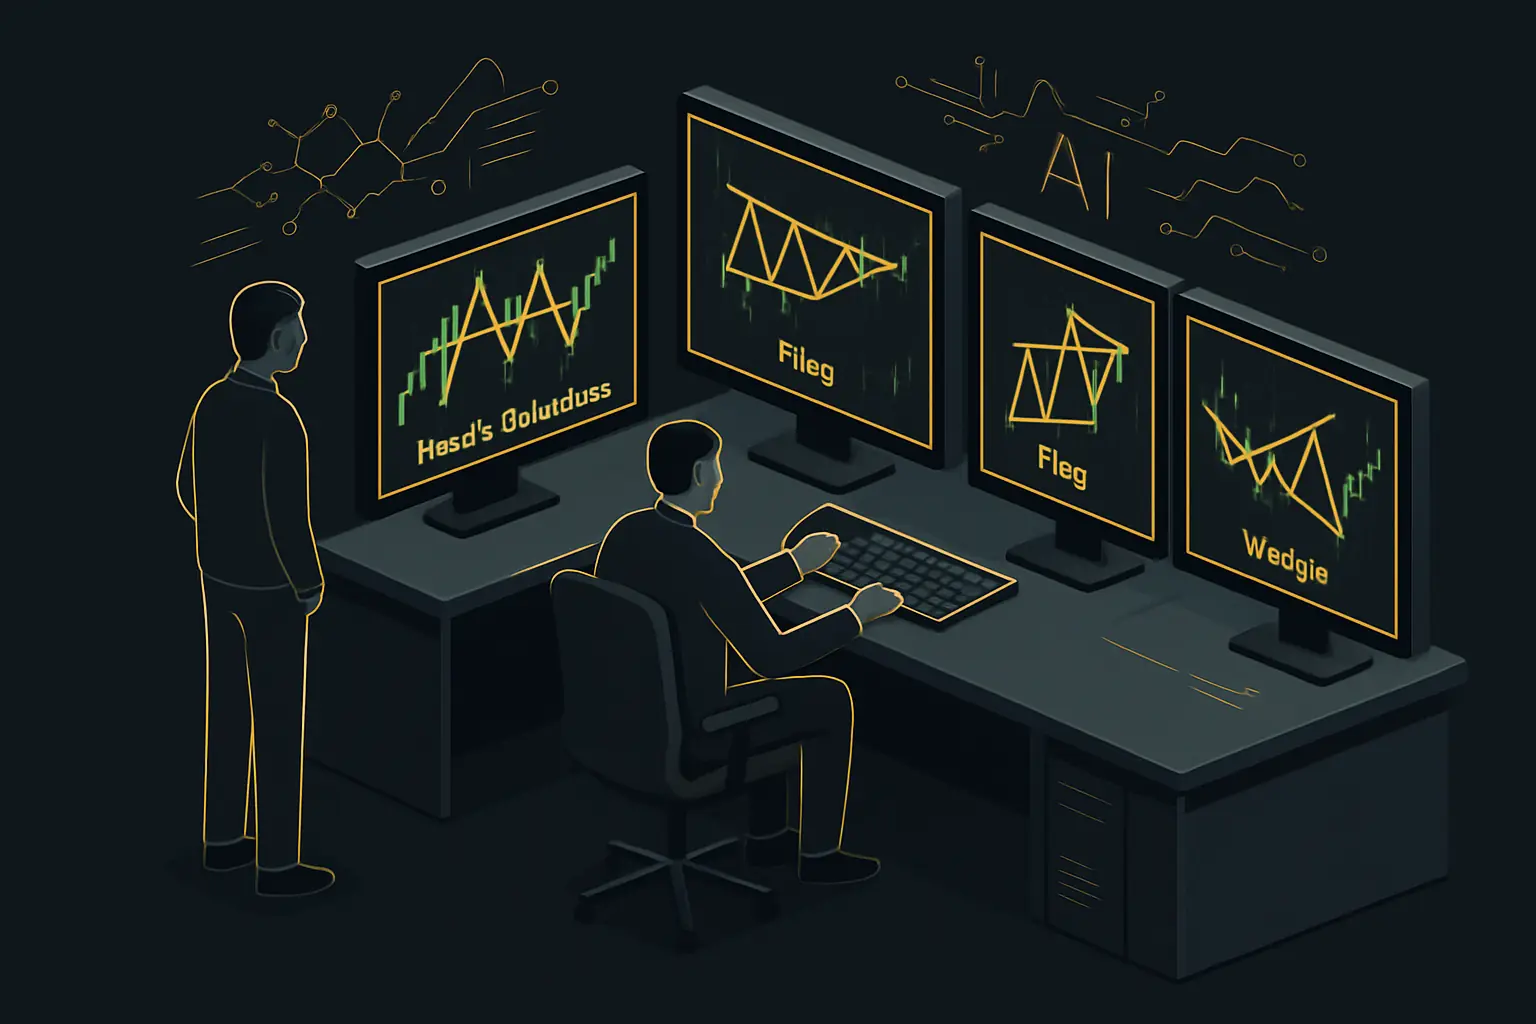
The head and shoulders is a classic trading chart pattern known for its reliability in signaling trend reversals. Visually, it forms three peaks: a higher “head” between two lower “shoulders.” This pattern stands out because it reflects a shift in market sentiment from bullish to bearish.
To trade this pattern, draw a “neckline” connecting the lows between the shoulders. A break below the neckline confirms the reversal. Traders often set entry orders just below the neckline, with stop-losses above the right shoulder.
For bullish reversals, look for the inverse head and shoulders, same rules, but flipped upside down. In 2024, several forex pairs like EUR/USD saw textbook head and shoulders breakdowns that led to significant price drops.
Statistically, this trading chart pattern has a high win rate, especially when confirmed with volume spikes on the breakout. To avoid false signals, always wait for a close below the neckline. This pattern works best on daily and 4-hour charts in trending markets.
For a deeper dive into similar setups, check out the 45 Must-Know Chart Patterns for Traders in 2025.
2. Double Top and Double Bottom
The double top and double bottom trading chart pattern signals a strong reversal after a prolonged trend. The double top forms after an uptrend, with price peaking twice at nearly the same level before falling. The double bottom is its bullish twin, two troughs at similar lows before a rally.
Key identifiers include the two peaks or troughs and a “neckline” connecting the intermediate low (for tops) or high (for bottoms). Entry is triggered when price breaks the neckline, with stops above the peaks (for tops) or below the troughs (for bottoms).
In the crypto market, Bitcoin’s double bottom in early 2024 preceded a major bull run. Confirm the pattern with rising volume on the breakout. Avoid trading if the peaks/troughs are uneven or the neckline is unclear.
This trading chart pattern shows a solid success rate, but false breakouts can occur, especially in choppy markets. Always use risk controls and avoid overleveraging.
3. Ascending and Descending Triangle
Triangles are powerful trading chart pattern formations showcasing a battle between buyers and sellers. An ascending triangle slopes upward, with a flat resistance line and rising support, suggesting bullish strength. A descending triangle is the opposite, with flat support and falling resistance, pointing to bearish momentum.
To trade, watch for a breakout above resistance (ascending) or below support (descending), ideally confirmed by a volume surge. Set entries just beyond the breakout level, stops inside the triangle, and targets based on the pattern’s height.
In forex, ascending triangles on EUR/JPY’s 1-hour chart offered reliable bullish breakouts in 2024. Triangles perform best in trending markets, and their reliability drops in sideways conditions.
Tracking recent data, these patterns boast above-average win rates when combined with volume analysis. Always wait for a decisive close outside the triangle before acting on this trading chart pattern.
4. Cup and Handle
The cup and handle trading chart pattern is favored for spotting bullish breakouts, especially in stocks. It resembles a rounded “cup” followed by a small, downward “handle.” This structure reflects consolidation before a strong upward move.
Entry is typically placed above the handle’s resistance, with stops below the handle’s low. The profit target is often the depth of the cup added to the breakout level.
A 2024 example: Apple (AAPL) formed a textbook cup and handle, breaking out to new highs after weeks of sideways action. Volume usually contracts during the handle, then expands on breakout.
While powerful in bull markets, this trading chart pattern can fail if the handle is too deep or the breakout lacks volume. Maximize risk/reward by trading in strong uptrends and waiting for confirmation.
5. Flag and Pennant Patterns
Flags and pennants are fast, continuation trading chart pattern setups. A flag is a small, rectangular pullback after a sharp move, while a pennant forms a tiny symmetrical triangle. Both indicate a pause before the trend resumes.
To trade, enter on a breakout in the direction of the prior move. Place stops below the flag or pennant, and target a move equal to the flagpole’s length.
Gold futures in 2024 often displayed bullish flag patterns before surging higher. Volume typically contracts during formation and expands on breakout, key for confirmation.
Be wary of choppy markets, as false flags are common. This trading chart pattern shines on 15-min to daily charts in strong trends. Use additional indicators to filter out fake signals.
6. Symmetrical Triangle
The symmetrical triangle trading chart pattern signals indecision, with price compressing between converging trendlines. Both support and resistance slope toward each other, forming a triangle that tightens over time.
A breakout can occur in either direction, so it’s vital to wait for a clear close above or below the triangle. Entry is placed beyond the breakout, with stops inside the pattern. Targets often match the triangle’s height.
In 2023-2024, major indices like the S&P 500 repeatedly formed symmetrical triangles before explosive moves. Volume usually drops during the pattern and spikes on breakout.
This trading chart pattern has a moderate win rate but is best in volatile or news-driven markets. Always manage risk, as fake breakouts are possible.
7. Wedge Patterns (Rising and Falling)
Wedges are slanted trading chart pattern setups signaling reversals or continuations. A rising wedge slopes up and typically signals a bearish reversal. Conversely, a falling wedge slopes down and hints at a bullish reversal.
Identify the pattern by drawing two converging trendlines. Entry occurs when price breaks out of the wedge, down for rising, up for falling. Place stops above/below the opposite side.
Ethereum’s falling wedge in 2024 led to a sharp recovery rally. Volume should decrease during formation and expand on breakout for confirmation.
This trading chart pattern excels in trending markets but can trap traders if the breakout lacks conviction. Avoid trading wedges in range-bound conditions.
8. Rectangle (Range) Pattern
A rectangle, or range, is a sideways trading chart pattern where price bounces between parallel support and resistance levels. It signals consolidation before the next big move.
To trade, wait for a breakout above resistance or below support. Enter on the breakout, with stops inside the rectangle. Targets are often equal to the range’s height.
Tesla (TSLA) spent much of early 2025 in a rectangle pattern before breaking out to new highs. Watch volume, a spike on breakout confirms validity.
This trading chart pattern is common in both trending and sideways markets. Beware of false breakouts and whipsaws; tight risk management is crucial.
9. Triple Top and Triple Bottom
Triple tops and bottoms are rare but powerful trading chart pattern signals. The triple top forms three peaks at similar levels, signaling a bearish reversal. The triple bottom is its bullish counterpart, three troughs at comparable lows.
Identify by spotting three clear highs or lows and a horizontal neckline. Enter on a break of the neckline, with stops above the peaks (for tops) or below the troughs (for bottoms).
In commodities, crude oil’s triple bottom in 2024 triggered a major uptrend. Volume confirmation is vital, look for increased activity on the breakout.
This trading chart pattern boasts a high reliability rate, but patience is key. Avoid trading if the peaks or troughs are uneven or the pattern is drawn out over too long a period.
10. Rounding Bottom (Saucer Bottom)
The rounding bottom, or saucer bottom, is a long-term bullish trading chart pattern. It forms as price gradually transitions from a downtrend to an uptrend, creating a smooth, rounded shape.
Entry is triggered when price breaks above the pattern’s resistance. Place stops below the lowest point of the saucer, and set profit targets equal to the depth of the pattern.
In 2024, the SPDR S&P 500 ETF (SPY) completed a rounding bottom that kicked off a multi-month rally. Volume should increase as the pattern matures for confirmation.
This trading chart pattern is best used on weekly charts for capturing major trends. Avoid premature entries, wait for a strong breakout and confirmation of trend reversal.
Combining Chart Patterns with Technical Indicators for Maximum Edge
Recognizing a trading chart pattern is powerful, but pairing it with technical indicators can supercharge your decision-making. In 2025’s data-driven markets, relying solely on patterns leaves gaps, combining both tools creates a more robust trading edge.
This synergy helps filter out false signals and provides extra confirmation before entering a trade. Whether you’re trading forex, stocks, or crypto, blending technical indicators with your favorite trading chart pattern raises your odds of success. Let’s break down how this combination works in practice.
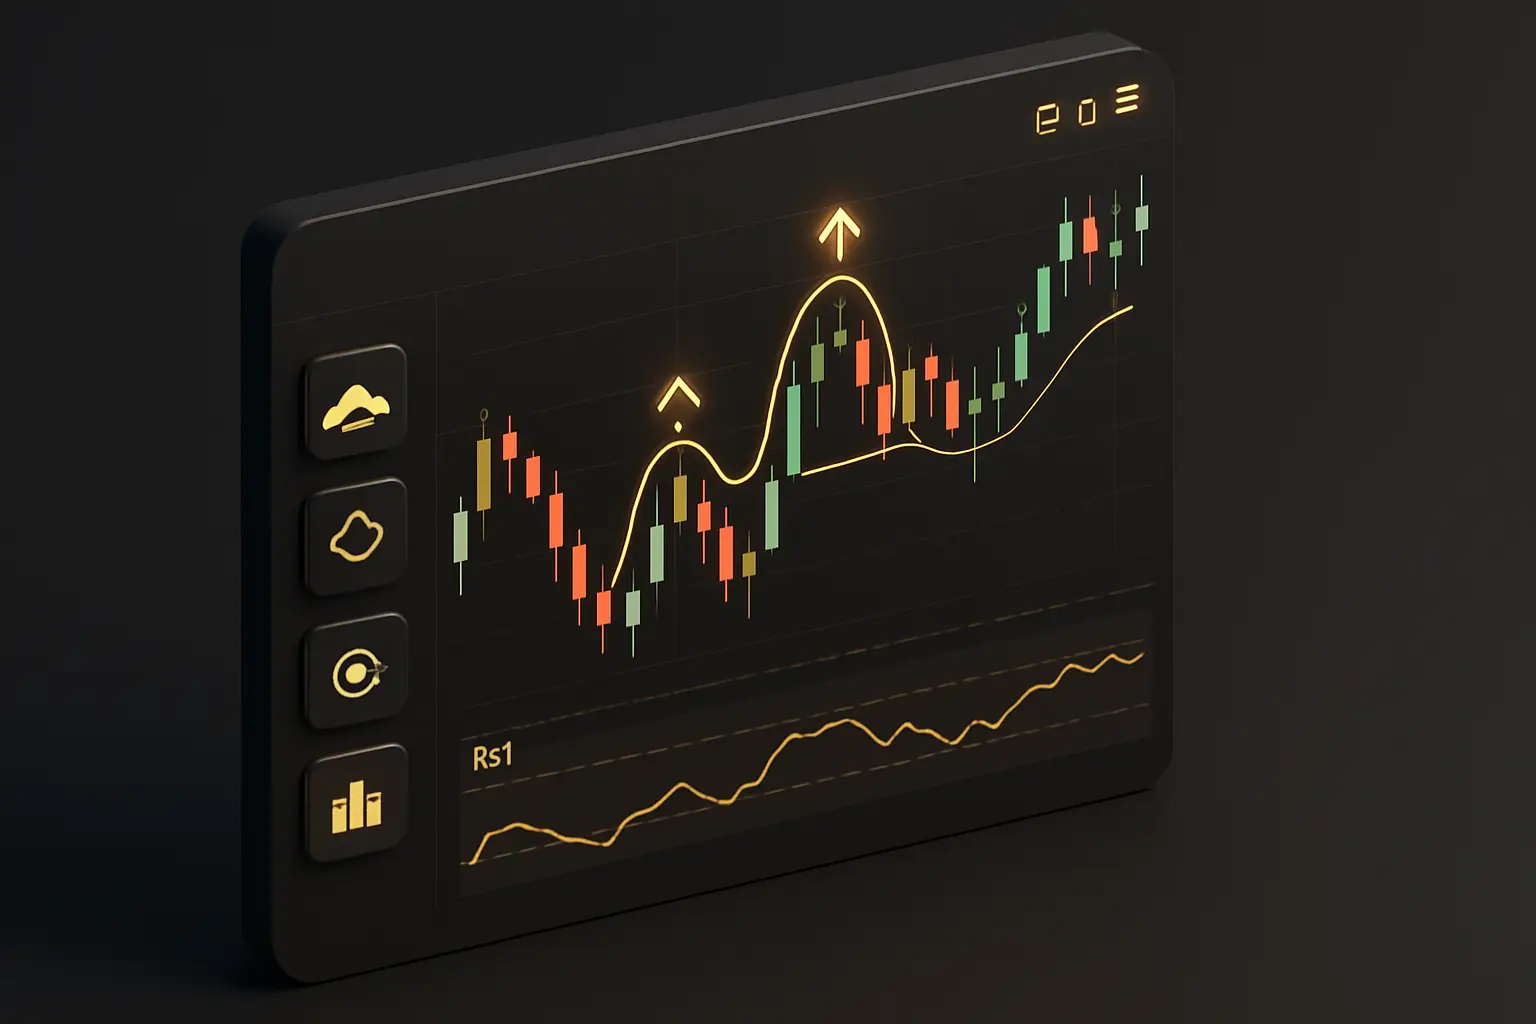
Why Combine Chart Patterns with Technical Indicators?
A trading chart pattern alone signals potential price direction, but indicators add context and confirmation. For instance, if you spot a double bottom, checking the Relative Strength Index (RSI) for bullish divergence can validate your idea. Moving averages help confirm trends, while MACD can spot momentum shifts.
Here’s a quick comparison:
| Chart Pattern | Indicator Confirmation | Benefit |
|---|---|---|
| Head & Shoulders | RSI, MACD, Volume | Stronger reversal signal |
| Triangle | Moving Average, Volume | Confirms breakout direction |
| Double Top/Bottom | RSI Divergence, MACD Cross | Filters out false reversals |
Combining both means you’re not just guessing, you’re stacking the odds in your favor with layered evidence from the market.
How to Confirm Chart Patterns Using Indicators
Confirmation is all about reducing risk and boosting confidence in your trading chart pattern strategy. Common confirmation methods include:
- RSI Divergence: If a trading chart pattern hints at reversal, check if RSI diverges from price.
- Volume Analysis: Breakouts from patterns like triangles or flags are more reliable with a volume spike.
- Moving Averages: A crossover supporting the trading chart pattern’s direction adds conviction.
For a deeper dive into how confirmation works, see Trading Signals Explained, which covers how signals and patterns work together.
Step-by-Step Workflow for Integration
Here’s a practical workflow to maximize the edge of a trading chart pattern by combining it with indicators:
- Spot the Pattern: Identify the trading chart pattern on your chart.
- Draw Support/Resistance: Mark key levels for clarity.
- Overlay Indicators: Add RSI, moving averages, or MACD to your chart.
- Seek Confirmation: Look for signals that align with your trading chart pattern’s expected move.
- Backtest: Test your approach on historical data for statistical confidence.
- Plan Entries & Stops: Only enter trades where both pattern and indicator align.
Platforms like TradingView make this process seamless, allowing you to overlay multiple indicators and patterns in real time. According to “Assessing the Impact of Technical Indicators on Machine Learning Models for Stock Price Prediction”, integrating technical indicators with chart patterns dramatically improves model accuracy and win rates, a testament to the power of this approach.
Risk Management and Simplicity
While combining technical indicators with a trading chart pattern increases accuracy, it’s crucial not to overcomplicate your strategy. Too many indicators can lead to analysis paralysis and missed opportunities.
Stick to two or three reliable confirmations per setup. Always use stop-loss orders and size your positions based on risk tolerance. Remember, no trading chart pattern or indicator is foolproof, risk management is your safety net.
In summary, blending chart patterns with technical indicators creates a powerful, data-driven trading approach. Just keep your toolkit simple, backtest your methods, and let confirmation guide your trades for maximum edge in 2025’s fast markets.
Advanced Tips for Mastering Chart Patterns in 2025
Success with any trading chart pattern in 2025 means adapting to an environment shaped by rapid tech advances, high volatility, and fierce competition. Staying ahead requires more than just memorizing shapes, it’s about evolving your approach, using the latest tools, and learning from every trade.
Adapting to AI-Driven and High-Volatility Markets
Markets are now heavily influenced by algorithms and machine learning. To master any trading chart pattern, traders should familiarize themselves with adaptive recognition tools. Research like “Stock Chart Pattern Recognition with Deep Learning” shows how automated systems can spot subtle patterns faster than ever.
Yet, automation isn’t a replacement for human judgment. Use these platforms to alert you to opportunities, but always verify signals with your own analysis and risk controls.
Real-Time Pattern Recognition and Journaling
Embrace real-time pattern recognition by leveraging platforms that scan multiple markets and timeframes. Set up alerts for your favorite trading chart pattern setups, but don’t forget the power of a trading journal.
By recording trades, noting which patterns worked, and reviewing both wins and losses, you’ll spot personal biases and refine your edge. Consider documenting not just the chart pattern, but also related candlestick setups for a complete review, resources like the Hammer Candlestick Pattern Guide can deepen your pattern knowledge.
Avoiding Overtrading and Understanding Market Context
Don’t fall into the trap of trading every signal. The best traders are selective, focusing on high-probability setups and adapting to macro trends, news, and sentiment. Avoid pattern chasing, sometimes, the best move is to wait for the right trading chart pattern to align with broader market context.
Use checklists to filter trades based on volatility, volume, and external events. This keeps your strategy robust and your risk in check.
Continuous Learning and Integrating Fundamentals
The landscape for trading chart pattern mastery is always changing. Join communities, attend webinars, and backtest new ideas regularly. Remember, chart patterns are powerful, but integrating fundamental analysis ensures you aren’t blindsided by unexpected news.
Continuous improvement, curiosity, and disciplined risk management are your best allies for thriving in 2025’s markets.
Now that you’ve seen how powerful chart patterns can be for spotting opportunities in 2025’s ever-changing markets, imagine combining that knowledge with real-time, AI-driven trading signals. That’s where PipTrend comes in, helping you make sense of patterns, filter out noise, and get instant alerts so you can act with confidence. Whether you’re trading forex, crypto, stocks, or indices, you deserve tools that simplify your decisions and boost your odds of success. Ready to see what smarter trading feels like? See Your Trading Improve With PipTrend
Risk Disclaimer: Trading involves risk. Past performance doesn't guarantee future results. Only trade with money you can afford to lose. PipTrend is a tool to assist your trading decisions, not financial advice.