timer 40% Price Increase Coming Soon, Lock In Your Rate Today arrow_forward
Blog Login Start Free Trial
check_circle Risk Math

Streak Probability Calculator

Losing streaks at a healthy win rate are normal. See how long yours can run, and size so a streak cannot end your account.

Streak odds
%
7
trending_down losing streak
expected worst losing streak
Best winning streak 7 in a row
Any single loss 45.0%
3 losses in a row 9.1%
5 losses in a row 1.8%
Max risk per trade 7.1%

A losing streak is normal variance, not a broken edge. Size so the worst case run cannot end your account.

planning estimate Runs in your browser
Probability of a run of this length over the sample
Streak length Losing run Winning run

Educational tool, not financial advice. Results depend on your broker's contract specs and pricing. Runs in your browser. Nothing you enter is stored.

Embed This Calculator

Add the Streak Probability Calculator to your website or blog. Copy the code below and paste it wherever you want the calculator to appear, it auto-adjusts to fit any container. Please keep the attribution line intact.

help_outline How to use this calculator

  1. 1Enter your win rate as a percentage (e.g. 55).
  2. 2Set the total number of trades you want to model (e.g. 100).
  3. 3Read the expected worst-case losing streak in the hero, and the best-case winning streak below it.
  4. 4Scan the probability curve and the breakdown table to see how likely each streak length is.
  5. 5Check the max risk per trade value, the largest risk that survives the worst-case streak without losing half the account.

How the Streak Math Works


                Single run: P = (1 - winRate)^N for a losing run of N, or winRate^N for a winning run.
Over T trades: P(at least one run of N) = 1 - (1 - p^N)^(T - N + 1)
Expected worst streak: the largest N whose in-sample probability is still 50% or more.
              

The over-T formula is a close approximation (it treats the runs as independent windows), not an exact Markov result. It is accurate for the trade counts traders actually use, and this tool reports the same numbers the previous version did.

Streaks Are Normal: the Math

A win rate is a long-run average, not a schedule. A 55% edge does not deal you wins and losses in a tidy alternating order; it scatters them, and that scattering produces runs. Over 100 trades at 55% you are more likely than not to see a 5-loss streak, and the expected worst run sits near 6 in a row. None of that means the edge has failed, it is exactly what a 55% process looks like up close.

The uncomfortable part is that higher win rates do not make streaks disappear. Even a 75% strategy carries a real chance of a 5-loss run over 100 trades, and a 30% win rate strategy that is highly profitable at wide reward to risk will hand you 10-loss runs regularly. Plan for the streak your win rate implies rather than the one you hope for.

Sizing So Streaks Cannot Kill You

Once you know your expected worst streak, sizing is arithmetic. If the worst run is 8 losses and you refuse to give back more than half the account to a normal streak, your risk per trade cannot exceed about 6%, and most traders should sit well under that. The max risk value above does this division for you so you can size to survive the drawdown, not just the average trade.

This is why streak math and position sizing belong together. A position size that looks fine against a single loss can still be fatal against a run of them, so size against the streak the sample will actually produce. Use the position size calculator to turn that risk percentage into a concrete lot size for each trade.

Tilt: the Real Cost of a Streak

The largest danger in a losing streak is rarely the drawdown itself, it is what the streak does to your decisions. After four or five losses the temptation is to size up to win it back, to widen stops, or to abandon the rules that gave you the edge in the first place. Each of those turns a normal, survivable run into an account-ending one.

The defense is to decide the plan before the streak, not during it. If the math above shows a 6-loss run is ordinary at your win rate, then a 6-loss run is not new information and does not justify a new plan. A systematic, repeatable entry model keeps you from improvising at the exact moment improvising costs the most.
quiz Frequently Asked Questions

How likely is a 5-trade losing streak?expand_more
More likely than most traders assume. At a 55% win rate over 100 trades, the probability of seeing at least one run of 5 losses is roughly 83%, so it is the expected outcome rather than bad luck. Even at a 75% win rate the chance stays high enough that you must size for it. Enter your own numbers above to see the exact figure for your win rate and sample.
What is the longest losing streak I should expect?expand_more
The tool reports an expected worst-case streak, defined as the run length whose chance of appearing in your sample is around 50%. Over 100 trades at a 55% win rate that is about 6 consecutive losses, and it lengthens as your win rate falls or your trade count grows. Treat that number as normal variance to plan around, not a sign that anything has broken.
Does a losing streak mean my edge is gone?expand_more
Usually not. Streaks of the length this calculator shows are a built-in feature of any win rate below 100%, so a run that matches the expected worst-case is exactly what a healthy edge looks like from close up. An edge is better judged over a large sample with a positive expectancy than over a handful of recent trades. Confirm the edge itself with the expectancy calculator rather than reading too much into one drawdown.
How should I size during a losing streak?expand_more
The same way you sized before it, or smaller, never larger. The instinct to increase risk to recover losses is what turns a normal streak into a blown account. Use the max risk per trade value above, which divides your drawdown tolerance by the worst-case streak, and keep each trade at or below it so a full run still leaves you with capital and an edge intact.

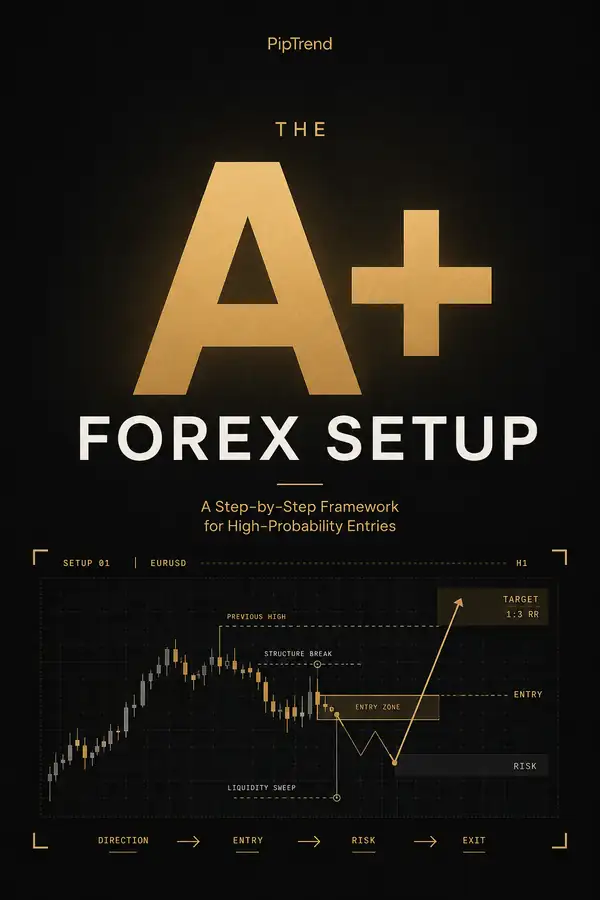
Get the free PipTrend A+ setup guide

We're finishing it now: the exact entries, exits, and risk rules our traders use, on one chart. Leave your email and we'll send it the day it's ready.

grid_view

Explore All Free Tools

Browse our full library of calculators, market tools, and trading resources.

Browse all tools arrow_forward

Want Smarter Signals on Your Chart?

These tools help you plan. PipTrend helps you execute, with a smart signal engine and adaptive trend detection right on your TradingView chart.

Secure checkout via Whop · Instant access · 30-day money-back guarantee