Top 12 Candle Patterns Traders Should Master in 2026
On this page
In 2026, mastering candle patterns is more crucial than ever for traders aiming to thrive in unpredictable markets. With volatility at record highs and trading increasingly driven by complex data, technical analysis has become an essential skill for all experience levels.
Understanding the top 12 candle patterns can dramatically improve your accuracy, boost your confidence, and enhance your profitability, regardless of your preferred asset class. In this article, you will discover the most vital candlestick patterns, learn how to apply them effectively, and gain practical insights to elevate your real-world trading results.
Understanding Candlestick Patterns: The Foundation of Modern Trading
Candlestick patterns are the backbone of technical analysis for traders in today’s fast-moving markets. Their visual nature makes it easier to interpret price action at a glance and make informed trading decisions. In 2026, as trading becomes more data-driven, mastering candle patterns is essential for anyone aiming to navigate financial markets with precision.
What Are Candlestick Patterns?
Candlestick patterns are visual representations of price movements over a fixed period, forming the foundation of technical analysis. Originating in 18th-century Japan, rice traders first used candlestick charts to capture market sentiment and predict price trends. Each candlestick consists of a body, which shows the open and close prices, and wicks (or shadows) that represent the high and low points. Color is also crucial, typically indicating bullish (often green or white) or bearish (red or black) momentum.
The arrangement of candlesticks forms candle patterns that reflect the psychological battle between buyers and sellers. For example, a long lower wick with a small body near the top signals that sellers pushed the price down, but buyers regained control before the close. This interplay is at the heart of how candle patterns provide insight into market sentiment and potential price action shifts.
Why Candle Patterns Remain Essential in 2026
In 2026, candle patterns are more relevant than ever due to the rise of algorithmic and AI-driven trading. Modern platforms increasingly rely on technical analysis tools, and traders who use candle patterns often achieve better timing for entries and exits. Data from IG and Groww highlights that strategies involving candlestick analysis consistently outperform those that ignore these signals.
Candle patterns help traders detect reversals, continuations, and market indecision in real time. Their integration into automated trading systems allows for faster, more accurate responses to changing conditions. For instance, recognizing a Hammer candlestick pattern guide can signal a major reversal, providing a clear edge in volatile environments. By combining these patterns with volume or moving averages, traders can confirm signals and avoid false positives.
Key Benefits of Mastering Candle Patterns
Mastering candle patterns offers several advantages for traders across all skill levels. The ability to spot high-probability setups increases accuracy and confidence, especially in volatile or uncertain markets. Candle patterns complement other technical indicators, creating a robust trading strategy adaptable to forex, stocks, crypto, indices, and commodities.
Key benefits include:
-
Enhanced identification of turning points and trend continuations.
-
Greater confidence in decision-making during market swings.
-
Versatility across different asset classes and timeframes.
For optimal results, traders often combine candle patterns with support and resistance levels, increasing the reliability of their entries and exits. This holistic approach ensures that candle patterns remain a cornerstone of modern trading strategies in 2026.
How to Effectively Read and Interpret Candle Patterns
Understanding how to read and interpret candle patterns is a core skill for any trader in 2026. With markets moving faster than ever, recognizing these visual cues can be the difference between a timely trade and a costly mistake. Let us break down the process into practical steps you can use right away.
Steps to Analyze Candlestick Patterns
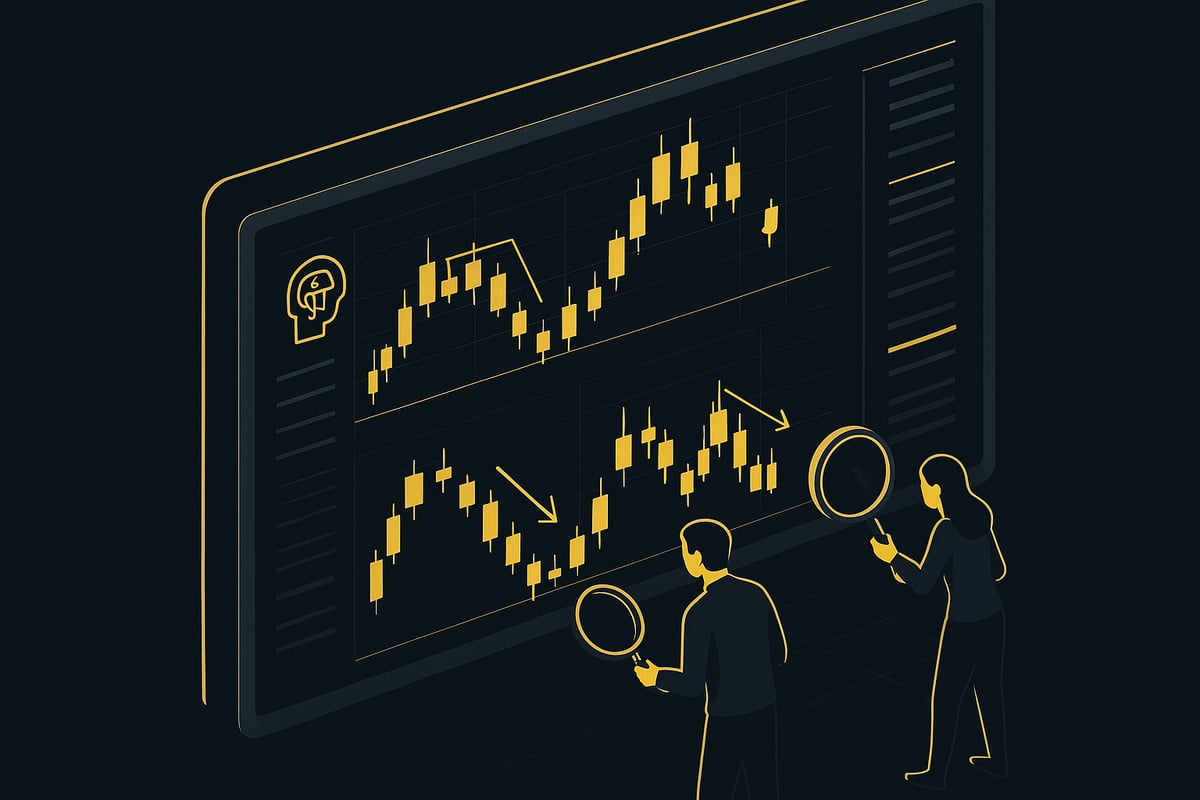
Begin by identifying the overall market trend. Are you in an uptrend, downtrend, or sideways phase? This context shapes how you interpret candle patterns.
Next, examine the chart for single, double, or triple candle formations. Patterns like the Hammer or Bullish Engulfing can signal reversals, while others point to continuation or indecision.
Always confirm what you see. Look for supporting evidence from volume spikes, trendlines, or other technical indicators. Relying solely on candle patterns can lead to false signals.
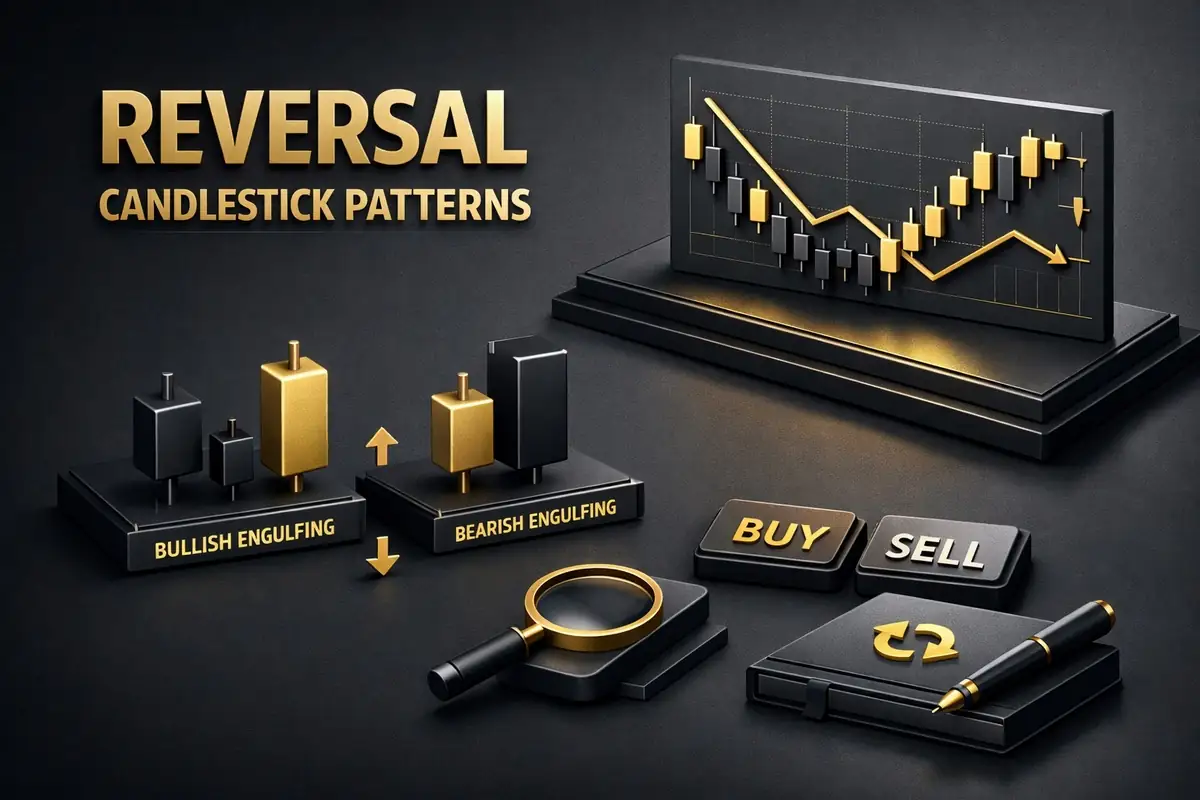
For deeper insights, explore resources like the Reversal candlestick patterns overview, which highlights how to spot key reversal setups.
Remember, not every pattern is a trading opportunity. Distinguishing between a genuine Bullish Engulfing and a failed reversal takes experience and careful analysis.
Integrating Candle Patterns Into Your Trading Plan
To make the most of candle patterns, blend them into your trading strategy. Set clear entry and exit points based on confirmed signals. For instance, after a pattern like the Piercing Line appears, wait for a confirming candle before entering a position.
Protect your capital by setting stop-loss and take-profit levels that align with the pattern’s structure. A stop just below the low of a Hammer, for example, can manage risk.
Backtest your approach on historical data. This practice helps you understand how candle patterns perform in various market conditions. Adjust your strategy for different timeframes and asset classes, whether you are day trading or holding longer-term positions.
Consistency is key. Track your decisions and outcomes to refine your approach over time.
Common Mistakes and How to Avoid Them
Traders often fall into traps when relying on candle patterns without proper confirmation. Avoid these pitfalls:
-
Entering trades without checking the broader trend
-
Ignoring economic news that can override technical signals
-
Confusing similar-looking patterns, such as Hanging Man and Hammer
-
Taking action on every Doji or small formation
To sidestep these issues, always combine candle patterns with other forms of analysis. Confirm signals, stay aware of market-moving events, and focus on quality over quantity.
Building skill in reading candle patterns takes patience and practice, but it leads to better timing and more consistent results.
Top 12 Candle Patterns Traders Should Master in 2026
Mastering candle patterns is crucial for any trader aiming to navigate 2026’s dynamic markets with confidence. Understanding these patterns not only sharpens your technical analysis but also helps you make timely, informed decisions in volatile conditions.
Below, we break down the top 12 candle patterns every trader should know. Each section highlights the structure, psychology, confirmation signals, and practical applications, empowering you to use these candle patterns for smarter trades.
1. Hammer
The Hammer is a single-candle pattern that signals a potential bullish reversal after a downtrend. It has a small body near the top of the range and a long lower shadow, showing that sellers pushed the price down, but buyers regained control.
-
Structure: Small real body, long lower wick, little or no upper wick.
-
Signal: Appears after a downtrend, suggesting a possible reversal.
-
Psychology: Bears dominate early, bulls fight back strongly.
-
Confirmation: Wait for a bullish candle after the Hammer.
-
Application: Works well in forex, stocks, and crypto.
A classic example is the S&P 500 reversing course after a Hammer pattern in 2025. Studies from IG and Groww rank the Hammer among the most reliable candle patterns for spotting reversals.
[caption id=“attachment_4289” align=“alignnone” width=“1536”]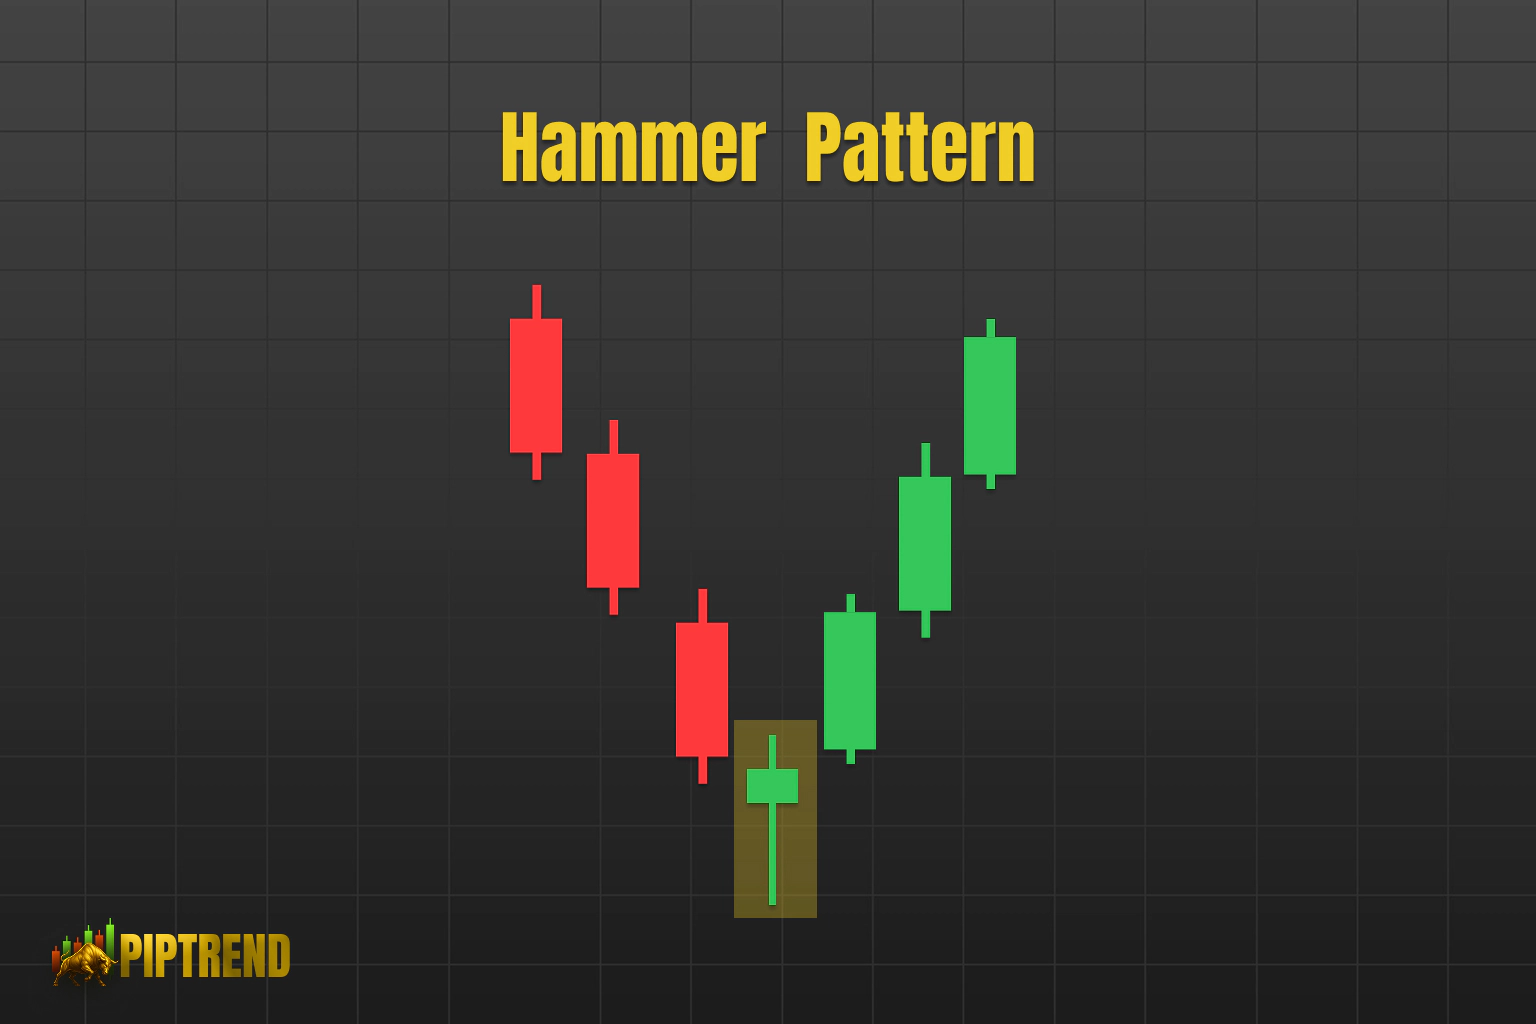 Chart illustrating the Hammer candle pattern in trading.[/caption]
2. Bearish Engulfing
Bearish Engulfing is a powerful two-candle pattern that often marks the end of an uptrend. The second candle is bearish and completely engulfs the previous bullish candle, indicating a shift in sentiment.
-
Structure: Large bearish candle engulfs a smaller bullish candle.
-
Signal: Appears after an uptrend, warning of a reversal.
-
Psychology: Sellers overpower buyers, momentum shifts.
-
Volume: High volume strengthens the signal.
-
Application: Ideal for stocks, forex, and crypto.
A notable example occurred with Bitcoin’s sharp decline after a Bearish Engulfing pattern in 2024. For best results, always wait for confirmation before acting on these candle patterns.
[caption id=“attachment_4285” align=“alignnone” width=“1536”]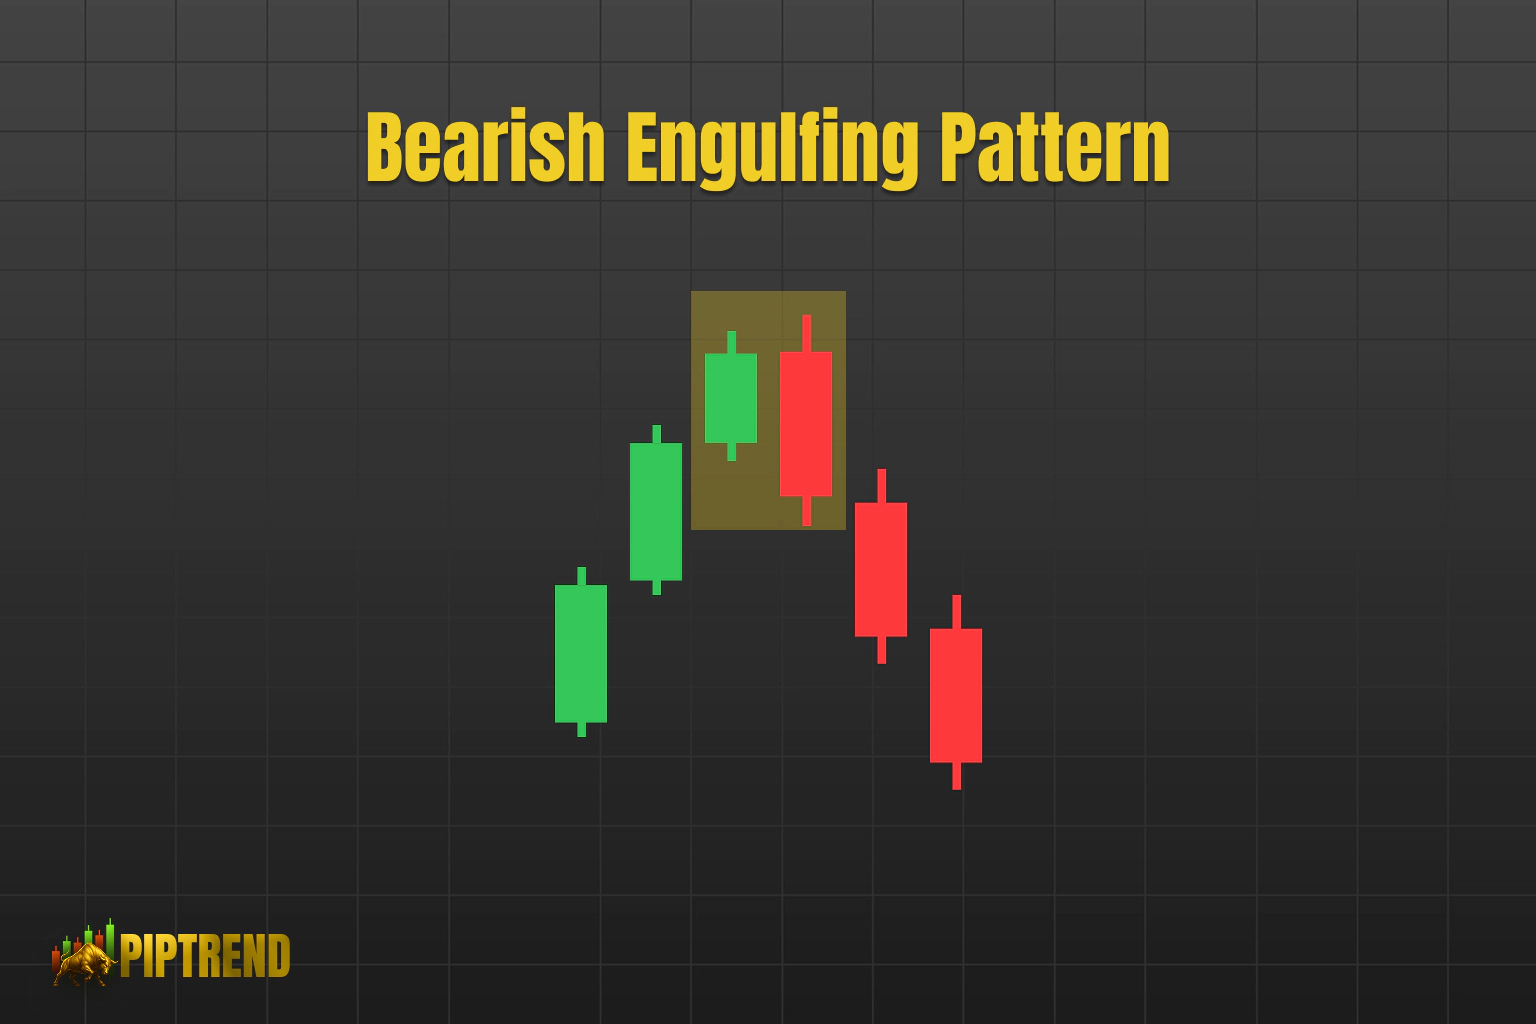 Bearish engulfing candle pattern illustrated with candlesticks.[/caption]
3. Morning Star
The Morning Star is a three-candle pattern that signals a strong bullish reversal after a downtrend. The first candle is bearish, followed by a small-bodied candle (doji or spinning top), then a large bullish candle.
-
Structure: Bearish, indecisive, then bullish candle sequence.
-
Signal: Reversal of a downtrend.
-
Psychology: Selling pressure fades, buying pressure builds.
-
Confirmation: Strong volume on the third candle adds reliability.
-
Application: Popular for swing trading.
NASDAQ’s rally after a Morning Star formation provided a textbook example of this pattern’s strength. Morning Star is especially effective in volatile markets, making it a favorite among traders using candle patterns.
[caption id=“attachment_4292” align=“alignnone” width=“1536”]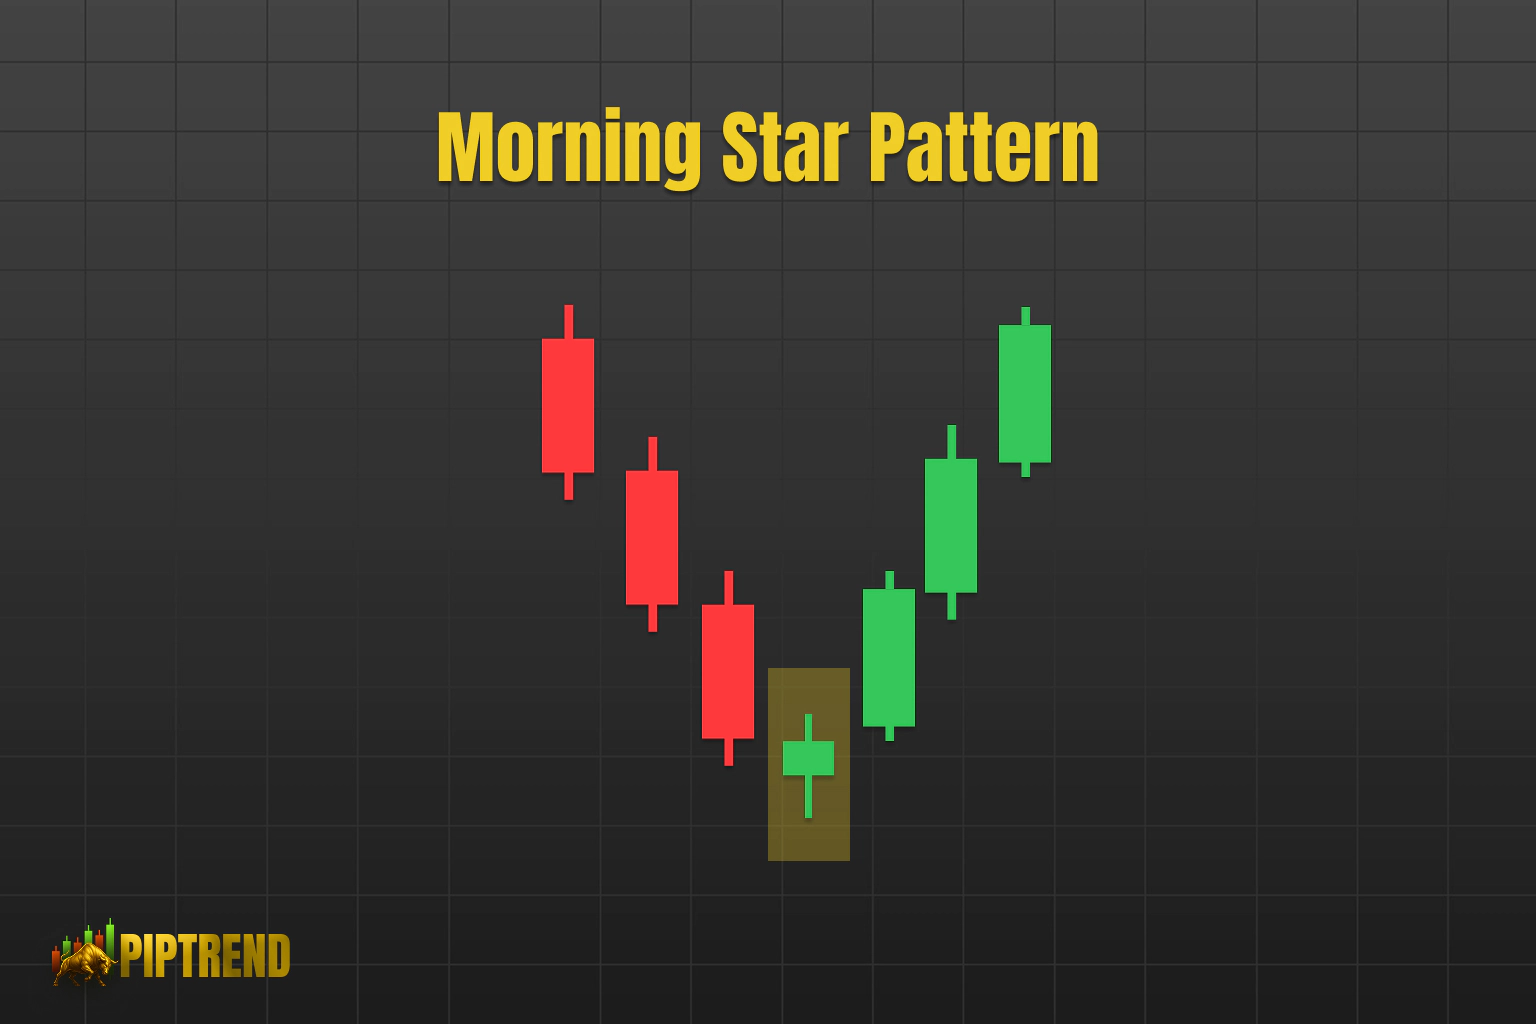 Illustration of the Morning Star candlestick pattern.[/caption]
4. Hanging Man
The Hanging Man looks similar to the Hammer but appears at the peak of an uptrend, warning of a bearish reversal. It features a small body and a long lower shadow.
-
Structure: Small real body, long lower wick, little or no upper wick.
-
Signal: Appears after an uptrend, potential for price drop.
-
Psychology: Buyers lose momentum, sellers step in.
-
Confirmation: Watch for a bearish candle next.
-
Application: Strongest when paired with resistance levels.
A clear example is the EUR/USD turning lower after a Hanging Man in early 2025. Always use other indicators alongside candle patterns like this for confirmation.
[caption id=“attachment_4290” align=“alignnone” width=“1536”]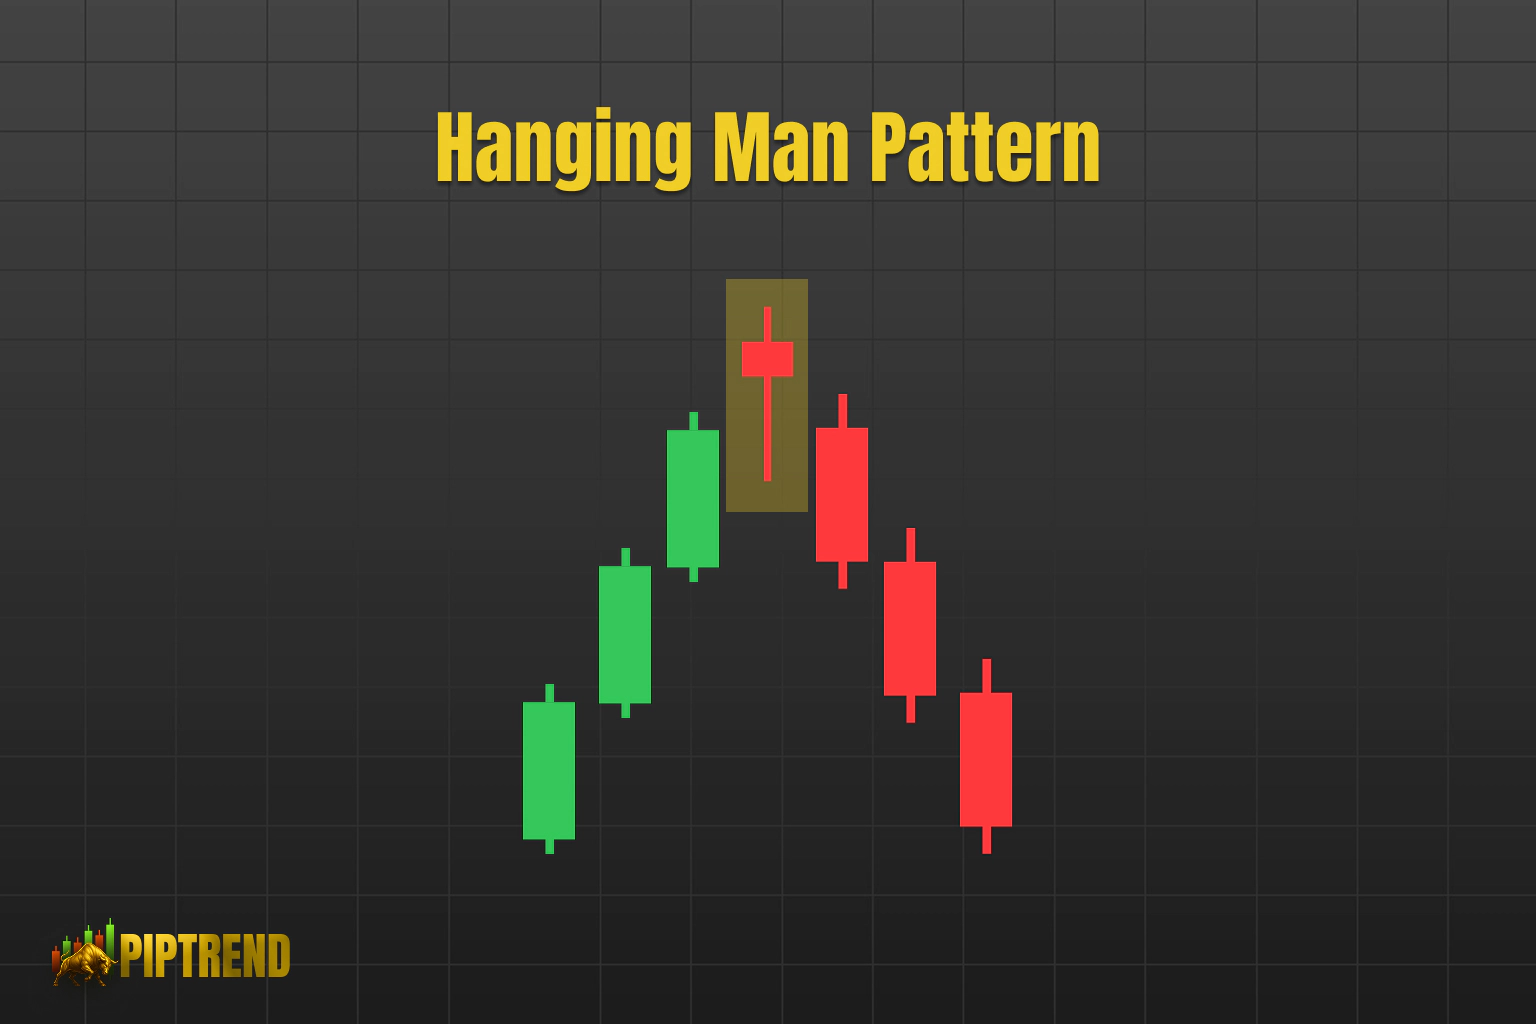 Illustration of the hanging man candle pattern with candlestick chart.[/caption]
5. Bullish Engulfing
Bullish Engulfing is a two-candle pattern that signals a bullish reversal after a downtrend. The second candle is bullish and fully engulfs the previous bearish candle.
-
Structure: Large bullish candle engulfs preceding bearish candle.
-
Signal: Reversal of a downtrend.
-
Psychology: Buyers overpower sellers.
-
Volume: High volume adds conviction.
-
Application: Works on any timeframe.
Tesla’s sharp rally in 2025 followed a Bullish Engulfing pattern, showcasing its effectiveness. Many traders rely on candle patterns like this for entry signals.
[caption id=“attachment_4286” align=“alignnone” width=“1536”]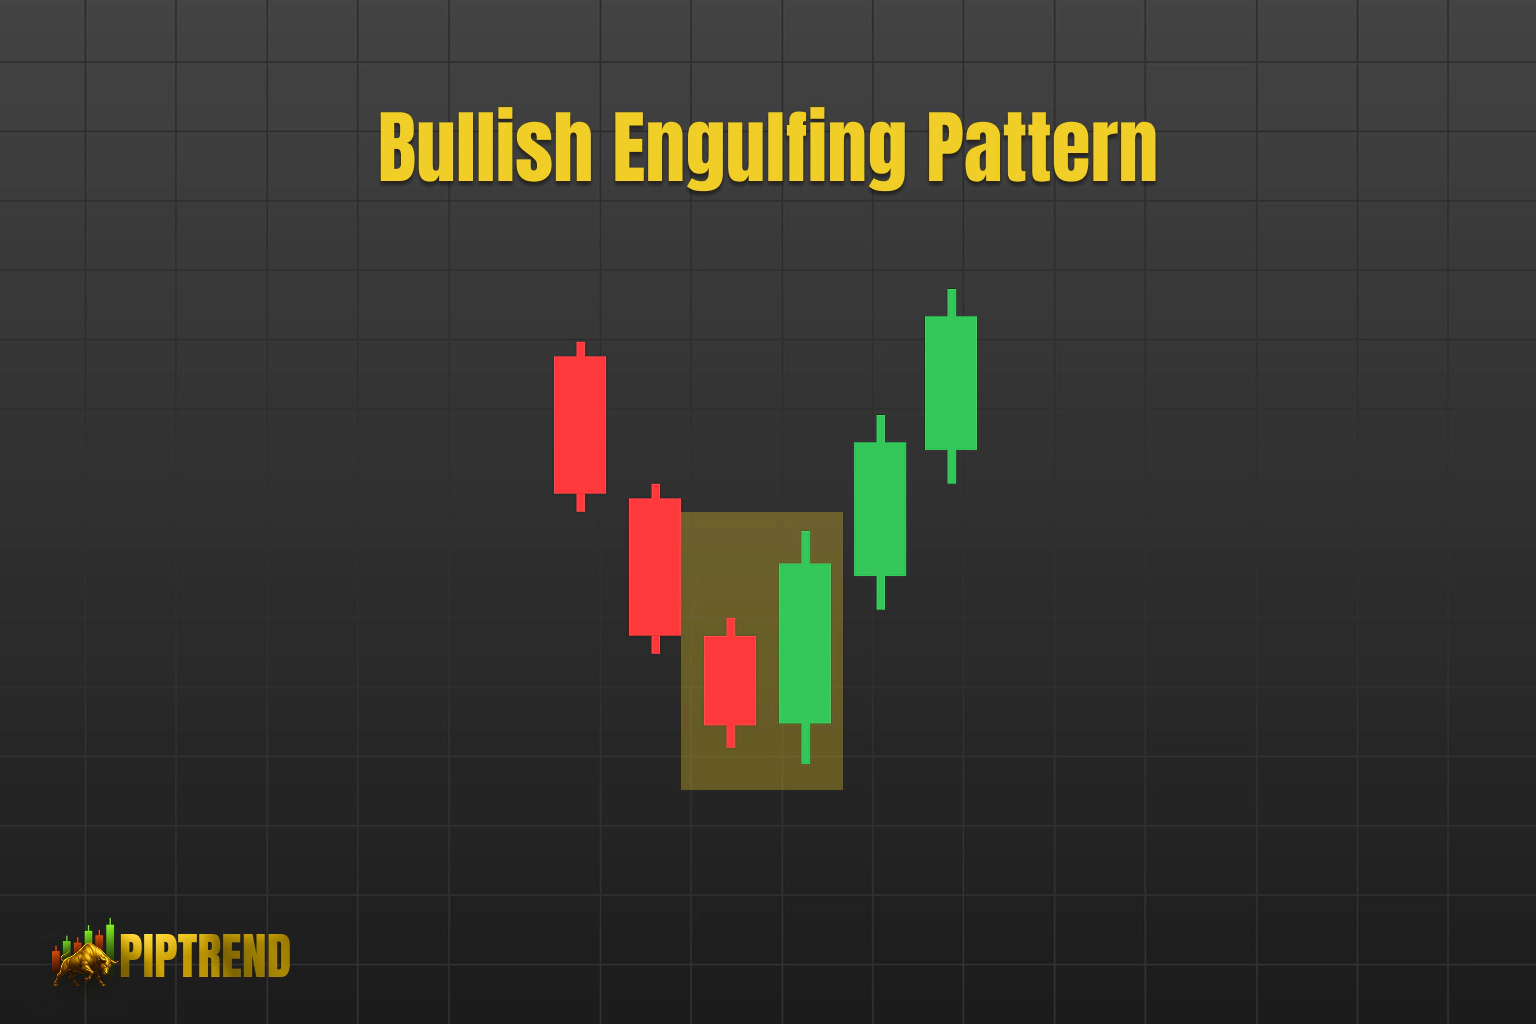 Illustration of a bullish engulfing candle pattern with colored candles.[/caption]
6. Shooting Star
Shooting Star is a bearish reversal pattern that appears after an uptrend. It has a small body and a long upper shadow, indicating buyers pushed prices up, but sellers took control.
-
Structure: Small body, long upper wick, little or no lower wick.
-
Signal: Reversal after an uptrend.
-
Psychology: Bulls lose steam, bears step in.
-
Confirmation: Next candle should be bearish.
-
Application: Useful for short-selling strategies.
Gold’s price drop after a Shooting Star is a prime example. Shooting Star is best used with resistance zones and other candle patterns.
[caption id=“attachment_4294” align=“alignnone” width=“1536”]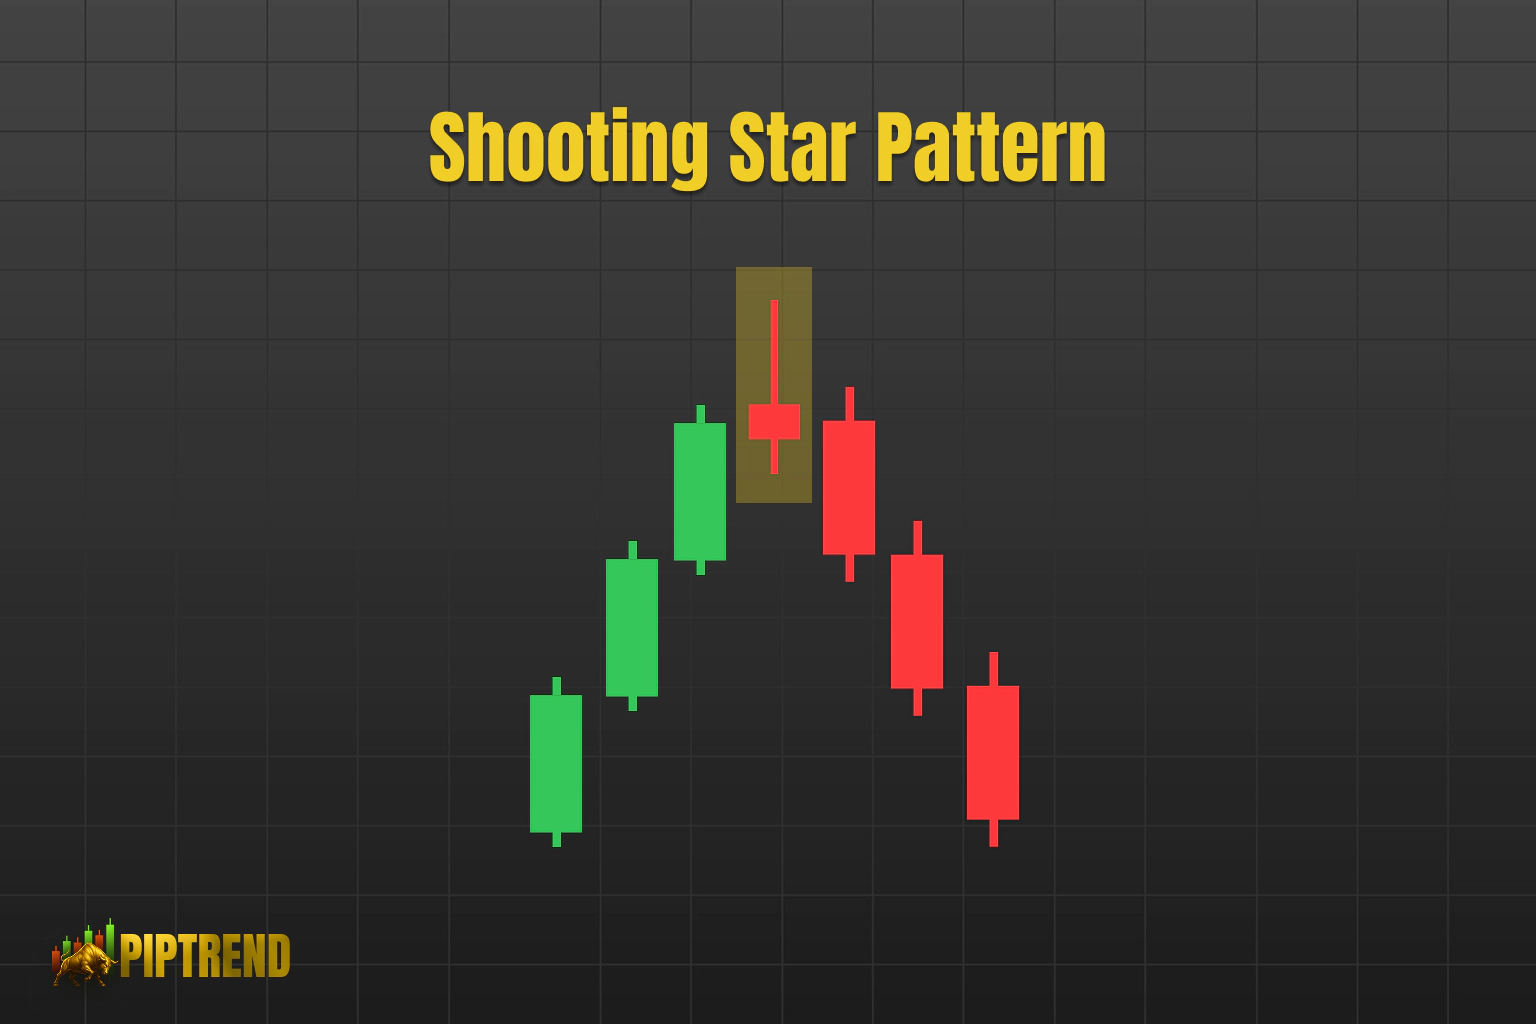 Shooting star candlestick pattern illustration.[/caption]
7. Doji
The Doji signals indecision in the market. Its open and close prices are nearly equal, forming a cross shape. This pattern can precede reversals or continuations, depending on the context and confirmation from later candles.
-
Structure: Open and close nearly identical, with varying wick lengths.
-
Signal: Market indecision, potential turning point.
-
Psychology: Balance between buyers and sellers.
-
Types: Standard, Dragonfly, Gravestone.
-
Application: Watch for confirmation.
A Doji often appears before major breakouts in the crypto market. For a deeper dive, see these Doji candle pattern insights. Always confirm Doji signals with subsequent candle patterns to avoid false moves.
[caption id=“attachment_4288” align=“alignnone” width=“1536”]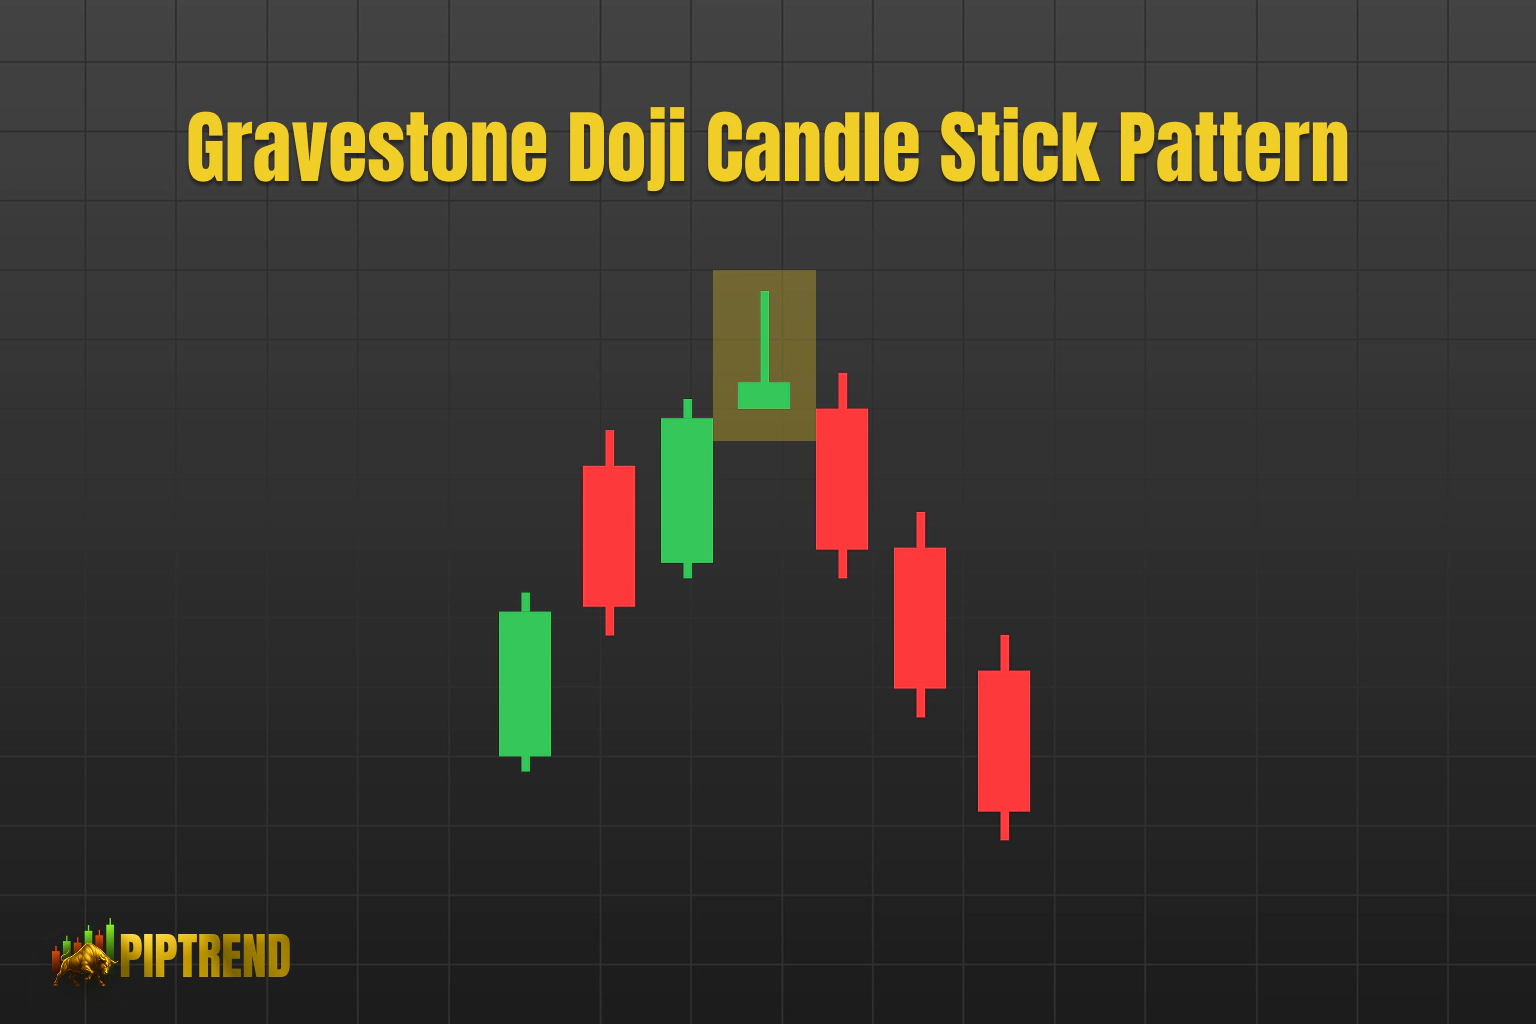 Illustration of the Gravestone Doji candlestick pattern.[/caption]
8. Piercing Line
Piercing Line is a bullish two-candle pattern that appears after a downtrend. The first candle is long and bearish, followed by a bullish candle that closes above the midpoint of the previous candle.
-
Structure: Bearish then bullish candle, with the second closing above the midpoint.
-
Signal: Bullish reversal.
-
Psychology: Buyers regain control after heavy selling.
-
Confirmation: Volume on the bullish candle strengthens the pattern.
-
Application: Effective in volatile markets.
Oil markets often rebound after a Piercing Line pattern, making it a favorite among traders who rely on candle patterns for timing.
[caption id=“attachment_4293” align=“alignnone” width=“1536”]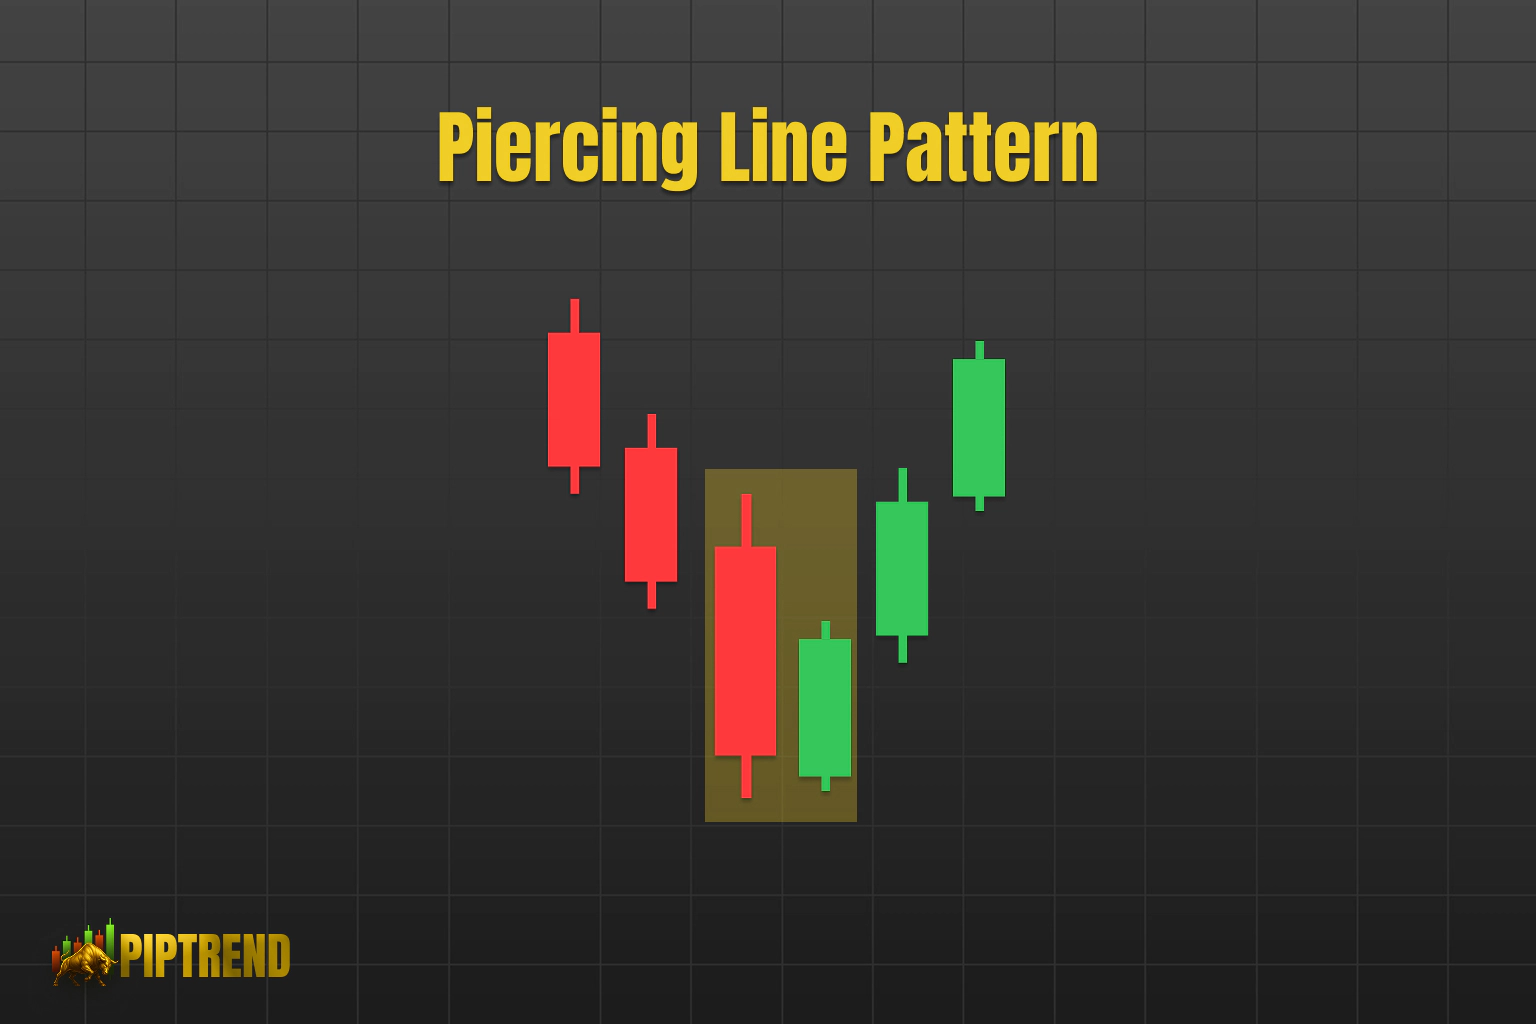 Candlestick chart showing a piercing line pattern.[/caption]
9. Three Black Crows
Three Black Crows is a bearish reversal pattern formed by three consecutive long bearish candles. It signals strong selling pressure after an uptrend.
-
Structure: Three long bearish candles, each closing lower.
-
Signal: Trend reversal from bullish to bearish.
-
Psychology: Sellers dominate for three sessions.
-
Application: Used to time exits or open short positions.
A Dow Jones correction following Three Black Crows is a classic example. This pattern is one of the most reliable bearish candle patterns for trend reversals.
[caption id=“attachment_4295” align=“alignnone” width=“1536”]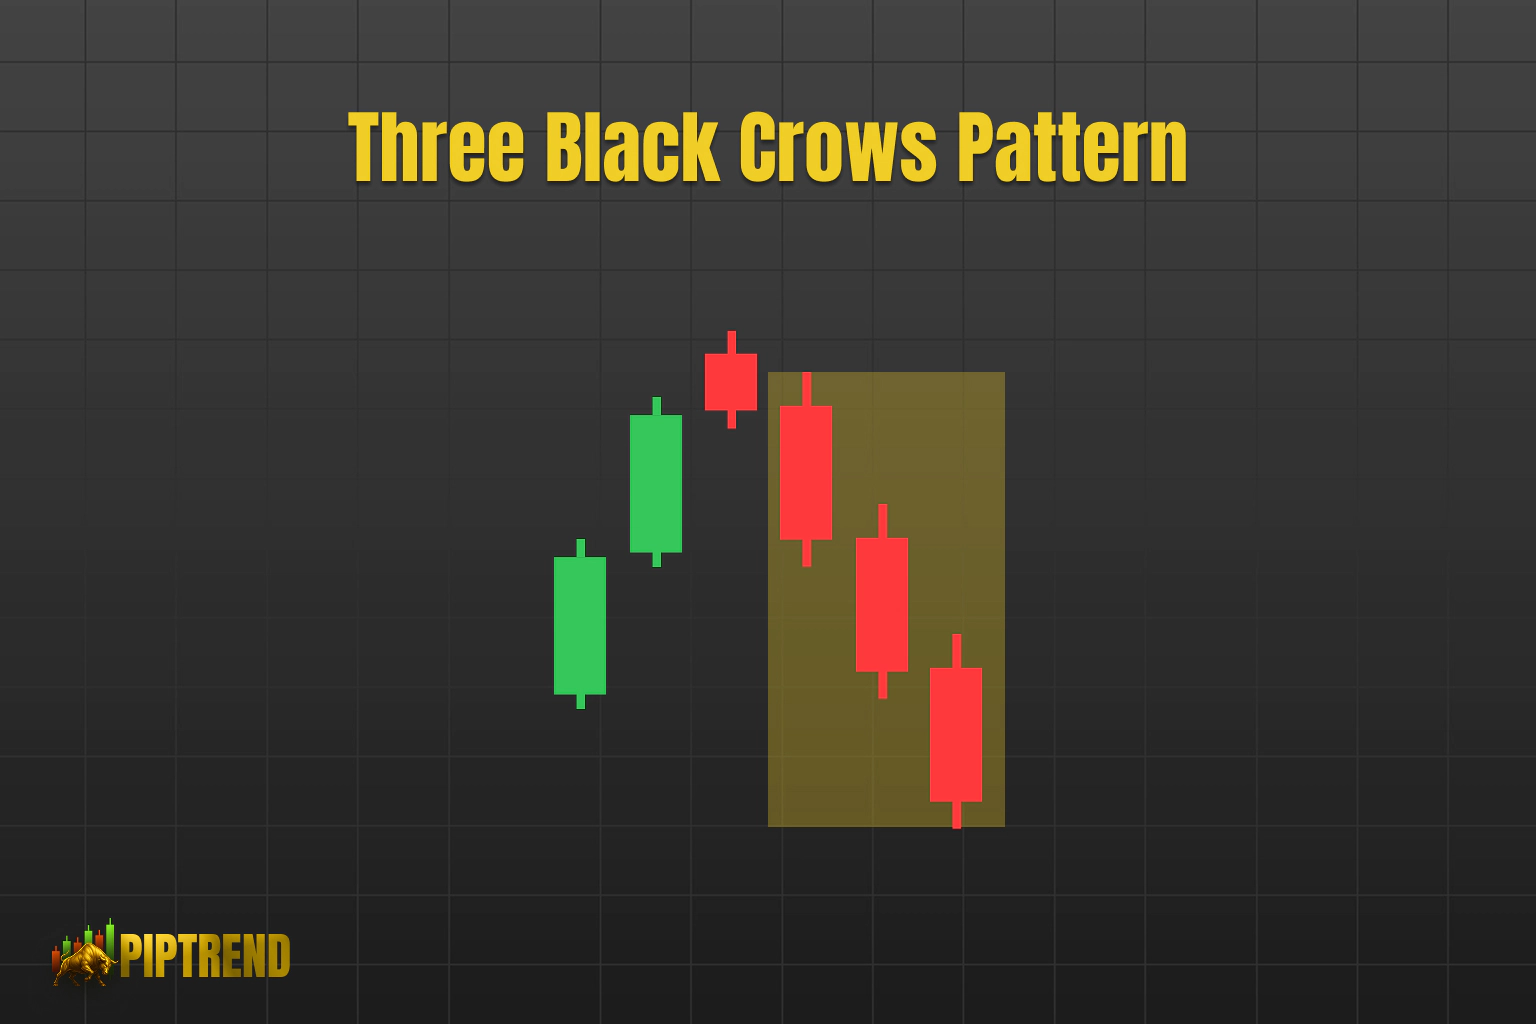 Illustration of the Three Black Crows candlestick pattern.[/caption]
10. Inverted Hammer
The Inverted Hammer appears after a downtrend and signals a potential bullish reversal. It has a small body and a long upper shadow.
-
Structure: Small body at the bottom, long upper wick, little or no lower wick.
-
Signal: Buyers test resistance, sellers cannot push lower.
-
Confirmation: Bullish candle next day confirms the reversal.
-
Application: Spotting early reversals.
GBP/USD often bounces after an Inverted Hammer, especially with volume confirmation. Candle patterns like this are vital for catching trend changes early.
[caption id=“attachment_4291” align=“alignnone” width=“1536”]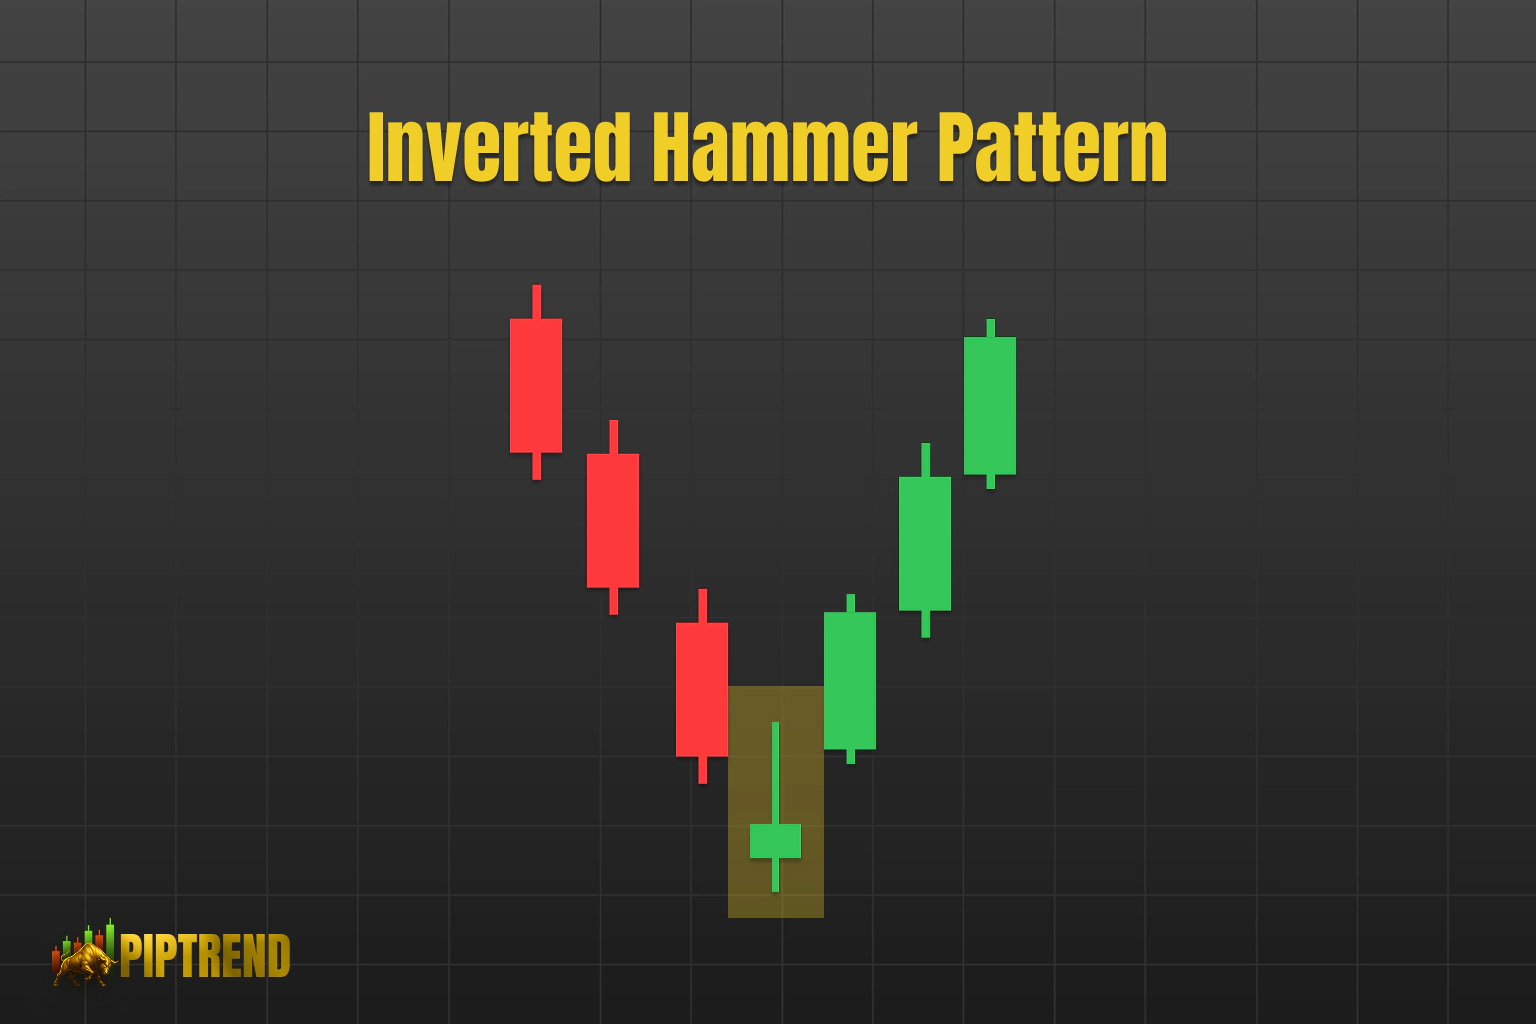 Illustration of the inverted hammer candle pattern with candlesticks.[/caption]
11. Dark Cloud Cover
Dark Cloud Cover is a bearish two-candle pattern seen at the end of an uptrend. The first candle is bullish, followed by a bearish candle that opens above and closes below the midpoint of the first.
-
Structure: Bullish then bearish candle, with the second closing below the midpoint.
-
Signal: Bearish reversal.
-
Psychology: Sellers regain control after a bullish run.
-
Confirmation: Stronger if the second candle opens above the first.
-
Application: Spotting shorting opportunities.
Tech stocks often pull back after a Dark Cloud Cover pattern. It is most effective when combined with other candle patterns and resistance levels.
[caption id=“attachment_4287” align=“alignnone” width=“1536”]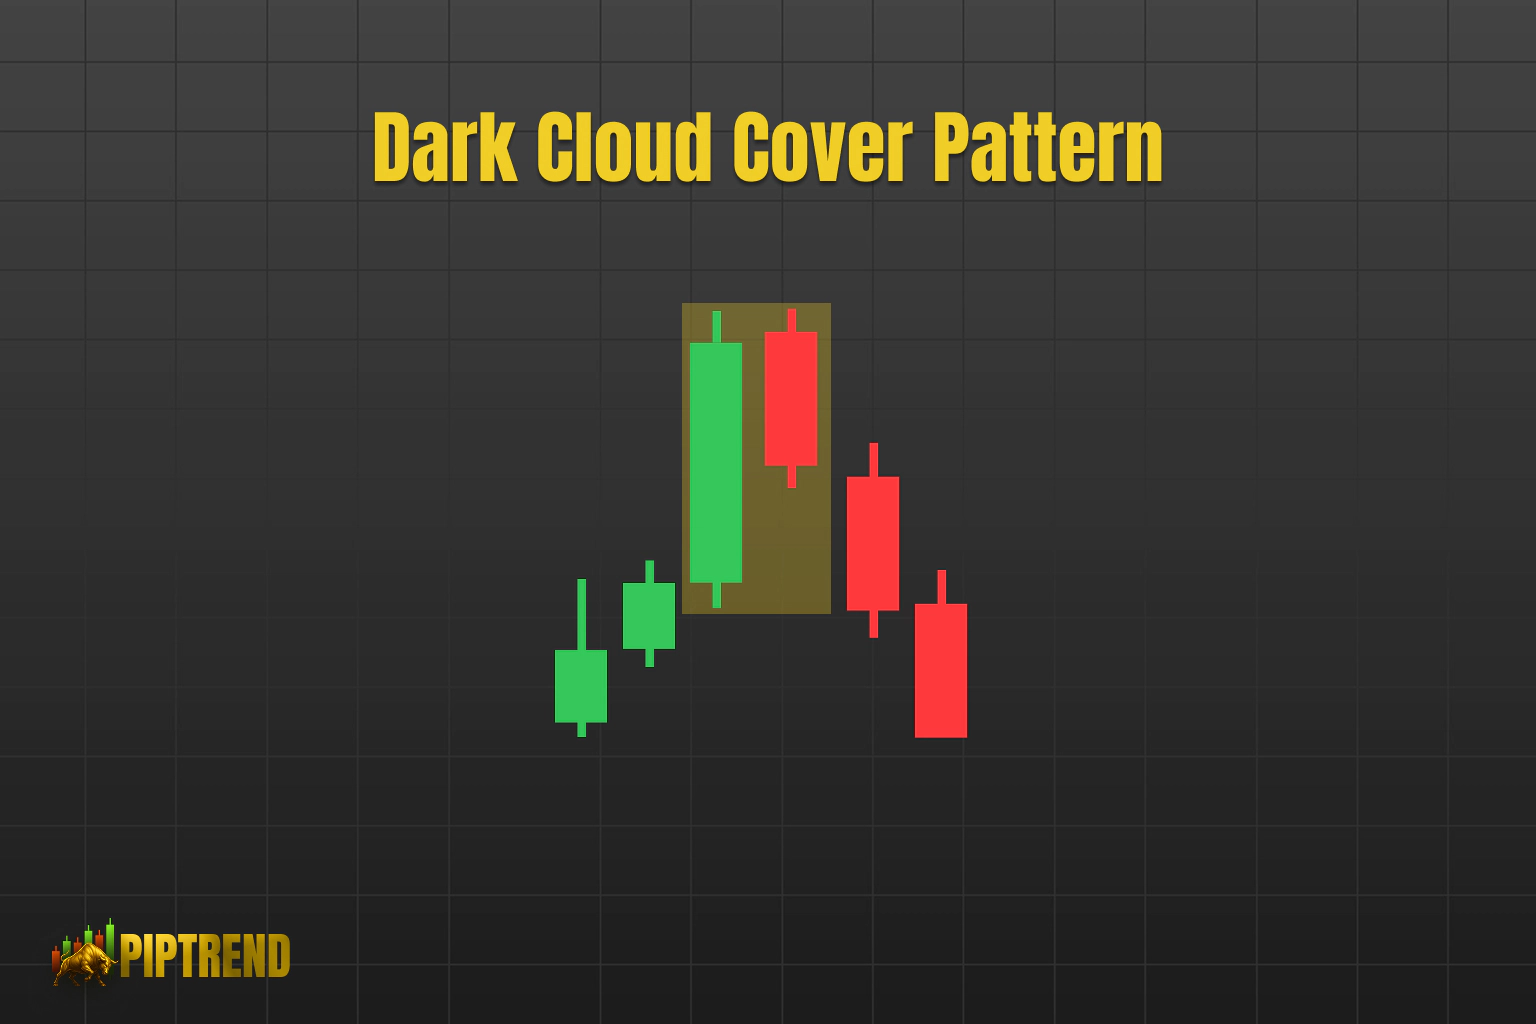 Dark Cloud Cover candle pattern on a trading chart.[/caption]
12. Three White Soldiers
Three White Soldiers is a bullish reversal pattern that features three consecutive long bullish candles after a downtrend. It signals sustained buying interest and a likely trend reversal.
-
Structure: Three long bullish candles, each closing higher.
-
Signal: Reversal from bearish to bullish.
-
Psychology: Buyers dominate for three sessions.
-
Application: Confirming entries into long positions.
Ethereum’s surge after Three White Soldiers in 2025 is a strong illustration. Among candle patterns, this one is highly reliable for signaling the start of new uptrends.
[caption id=“attachment_4296” align=“alignnone” width=“1536”]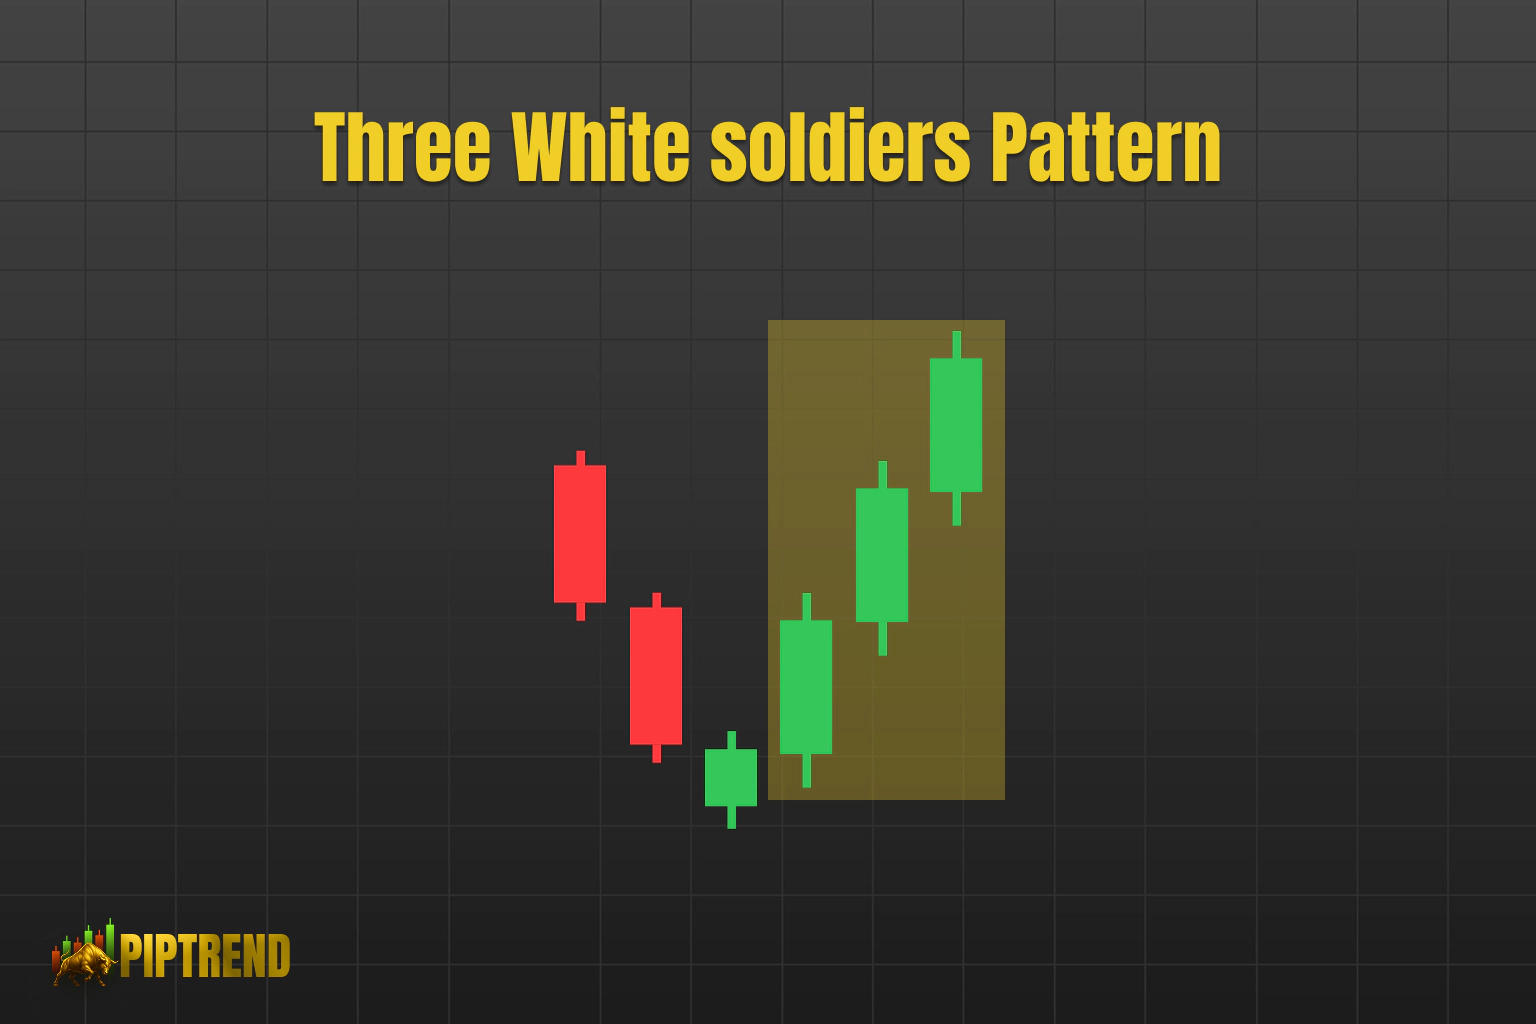 Illustration of the Three White Soldiers candlestick pattern.[/caption]
Pattern Summary Table
Pattern | Type | Signals | Reliability | Best Use Case |
|---|---|---|---|---|
Hammer | Bullish | Reversal | High | All asset classes |
Bearish Engulfing | Bearish | Reversal | High | Stocks, crypto, forex |
Morning Star | Bullish | Reversal | High | Swing trading |
Hanging Man | Bearish | Reversal | Medium | With resistance |
Bullish Engulfing | Bullish | Reversal | High | Any timeframe |
Shooting Star | Bearish | Reversal | Medium | Short-selling |
Doji | Neutral | Indecision | Varies | Confirmation needed |
Piercing Line | Bullish | Reversal | Medium | Volatile markets |
Three Black Crows | Bearish | Reversal | High | Exits, shorts |
Inverted Hammer | Bullish | Reversal | Medium | Early trend change |
Dark Cloud Cover | Bearish | Reversal | High | Shorting signals |
Three White Soldiers | Bullish | Reversal | High | Uptrend confirmation |
Learning these candle patterns gives traders a distinct edge, allowing for better timing and more profitable trades in 2026. Consistent practice and pattern recognition are key to mastering these strategies.
Advanced Tips for Using Candle Patterns in 2026’s Markets
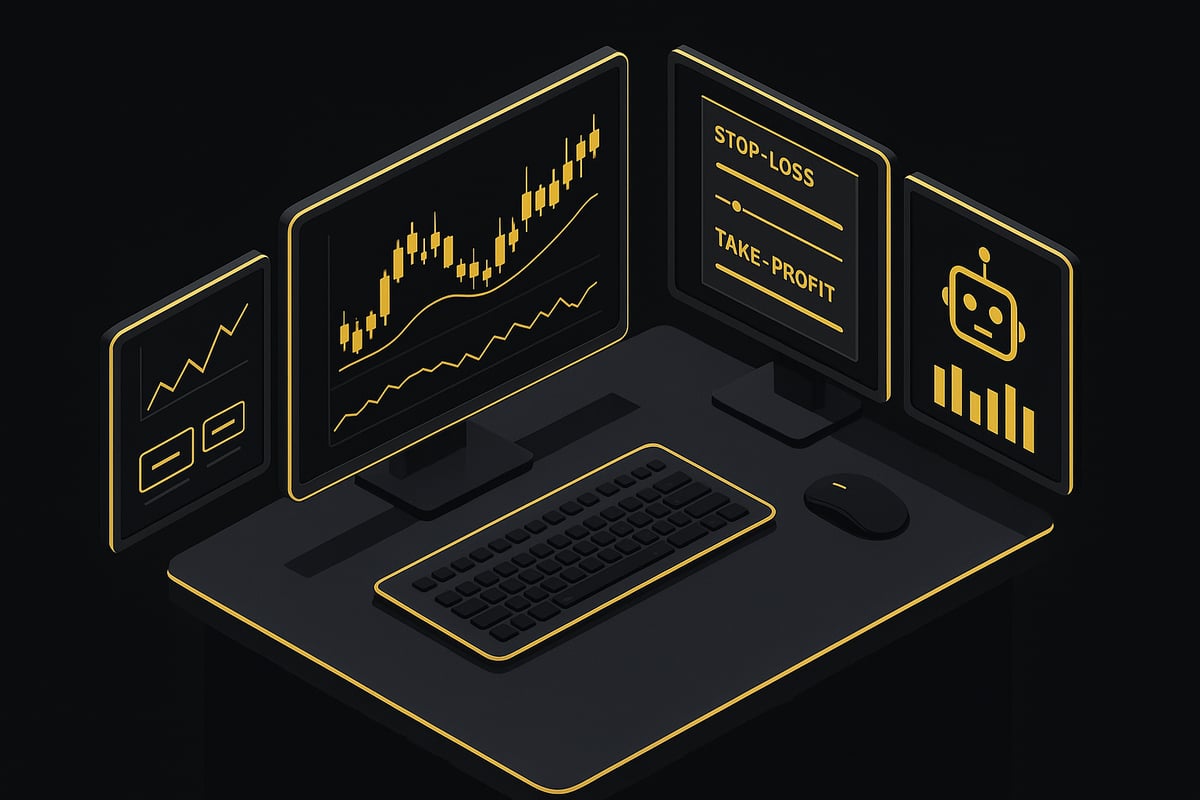
Navigating 2026’s markets demands more than just recognizing candle patterns. To consistently outperform, traders must combine technical know-how with modern tools and risk management. Here are advanced strategies to elevate your trading with candle patterns this year.
Combining Candle Patterns with Other Indicators
Relying solely on candle patterns can lead to missed signals or false entries. To boost your accuracy, always pair candle patterns with trusted technical indicators. Moving averages, RSI, and MACD are popular choices for confirming price momentum or trend direction.
For example, a bullish engulfing pattern confirmed by an oversold RSI increases the probability of a successful trade. Volume spikes can further validate the strength behind a pattern. If you want to see visual examples, bullish candle pattern examples can help you recognize setups in real market conditions.
Here is a quick comparison:
Indicator | Confirms | Best Use Case |
|---|---|---|
RSI | Overbought/oversold zones | Reversal patterns |
Moving Average | Trend direction | Continuation patterns |
MACD | Momentum shifts | Entry/exit signals |
Integrating these tools with candle patterns gives you a robust edge in volatile markets.
Adapting Patterns to Algorithmic and AI-Driven Trading
The trading landscape is rapidly evolving as more traders use algorithms and AI to analyze candle patterns. Automated systems can scan thousands of charts, spot patterns, and execute trades in milliseconds. This efficiency means you must refine your approach to stay competitive.
Many modern platforms employ real-time pattern recognition with deep learning. For instance, new research on market strength prediction using CNNs on candlestick chart images showcases how AI can interpret complex data visually, often faster than humans.
To adapt, backtest your candle patterns with historical data and adjust your strategies for high-frequency environments. Stay informed about updates in trading technology to keep your methods relevant in 2026.
Managing Risk and Maximizing Reward
Smart risk management starts with using candle patterns to set clear stop-loss and take-profit levels. It is wise to define your risk before entering any position. For example, when trading a hammer, place your stop-loss just below the candle’s low to limit losses if the reversal fails.
Calculate your risk/reward ratio for every trade. Many successful traders risk less than 2 percent of their capital per trade, ensuring longevity in the markets. Use candle patterns to help identify optimal entry points and set realistic profit targets.
Remember, the size of the pattern can guide your position sizing. Consistency in this approach is vital for maximizing long-term gains and minimizing emotional trading decisions.
Common Pitfalls to Avoid in 2026
Even experienced traders can fall into traps with candle patterns. One common mistake is acting on every signal without confirmation from other indicators. This can quickly lead to overtrading and unnecessary losses.
Do not ignore broader market trends or breaking news. Economic events can override technical signals. Another pitfall is misinterpreting similar-looking patterns, such as confusing a hanging man with a hammer, which can produce costly errors.
Stay disciplined by journaling your trades and reviewing outcomes. Avoid chasing minor patterns or trading in low-liquidity environments. Keeping a clear checklist for each candle pattern setup will help you sidestep these common issues.
Practice and Continuous Learning: Mastery Through Experience
Mastering candle patterns is not a one-time achievement but an ongoing process. Success in trading requires consistent practice, reflection, and adaptation. Let us explore how to build your expertise step by step.
Building Pattern Recognition Skills
Developing an eye for candle patterns starts with hands-on experience. Using a demo account allows you to spot, interpret, and react to patterns in real time without risking capital.
Keep a detailed trading journal. Document each trade with screenshots and notes on the candle patterns observed, entry and exit points, and outcomes. Over time, review your trades to identify which patterns yield the best results.
For example, you can track the success rate of bullish reversal patterns over 50 trades. Research such as the Profitability of Bullish Reversal Candlestick Patterns highlights the value of systematic tracking for evaluating technical strategies.
Leveraging Technology for Pattern Mastery
Modern trading platforms offer built-in tools for recognizing candle patterns automatically. adaptive indicators can scan charts, send instant alerts, and even analyze high-frequency data for more precise pattern detection.
Platforms like TradingView or MetaTrader make it easier to practice and refine your strategy. Some advanced methods, as discussed in studies on candlestick-based spot covariance estimation, use high-frequency candle patterns to enhance statistical accuracy in volatile markets.
By embracing these technologies, traders can sharpen their pattern recognition and respond faster to market shifts.
Staying Updated with Evolving Market Dynamics
Markets change rapidly, especially with new digital assets and global events. To keep your candle patterns analysis effective, stay informed about emerging trends and market shifts.
Join trading communities, follow expert analysis, and learn from case studies of traders who thrived in recent years. The Impact of COVID-19 on Candlestick Patterns reminds us that external events can influence the reliability of certain patterns, making adaptability crucial.
Continuous learning ensures your trading strategies remain relevant and resilient.
Developing a Personalized Pattern Playbook
Every trader’s journey with candle patterns is unique. Create a checklist for each pattern you use, including confirmation signals, risk parameters, and historical performance.
Adjust your playbook based on your risk tolerance and trading style. Focus on patterns that consistently show a 70 percent or higher success rate in your chosen market. This personalized approach helps you trade with greater confidence, discipline, and consistency.
Now that you’ve explored the top candle patterns every trader should master in 2026, it’s clear that real time analysis and timely decisions are more important than ever. With adaptive tools like PipTrend, you can put this knowledge into practice and spot high probability trades as they happen across forex, stocks, crypto, and more. Why not take the next step and see how your trading can improve with instant alerts and clear buy and sell signals? If you’re serious about gaining confidence and consistency, See Your Trading Improve With PipTrend.
Risk Disclaimer: Trading involves risk. Past performance doesn't guarantee future results. Only trade with money you can afford to lose. PipTrend is a tool to assist your trading decisions, not financial advice.