Candlestick Indicators Guide: Mastering Patterns in 2025
On this page
Are you ready to unlock the secrets of candlestick indicators and gain a decisive edge in trading for 2025? Mastering these powerful tools can turn market noise into clear, actionable signals.
This guide equips you to confidently interpret candlestick indicators, revealing the story behind every price movement. You will discover foundational concepts, essential bullish and bearish patterns, and how to blend them with the latest trading technologies.
With real-world examples and step-by-step strategies, you will develop the skills to boost your trading performance. Start your journey to trading mastery and prepare to thrive in evolving markets.
Understanding Candlestick Indicators: Foundations for 2025
Candlestick indicators are foundational tools for traders in every market. Their ability to visualize price action, sentiment, and market psychology makes them essential for anyone aiming to navigate the evolving trading landscape of 2025.
What Are Candlestick Indicators?
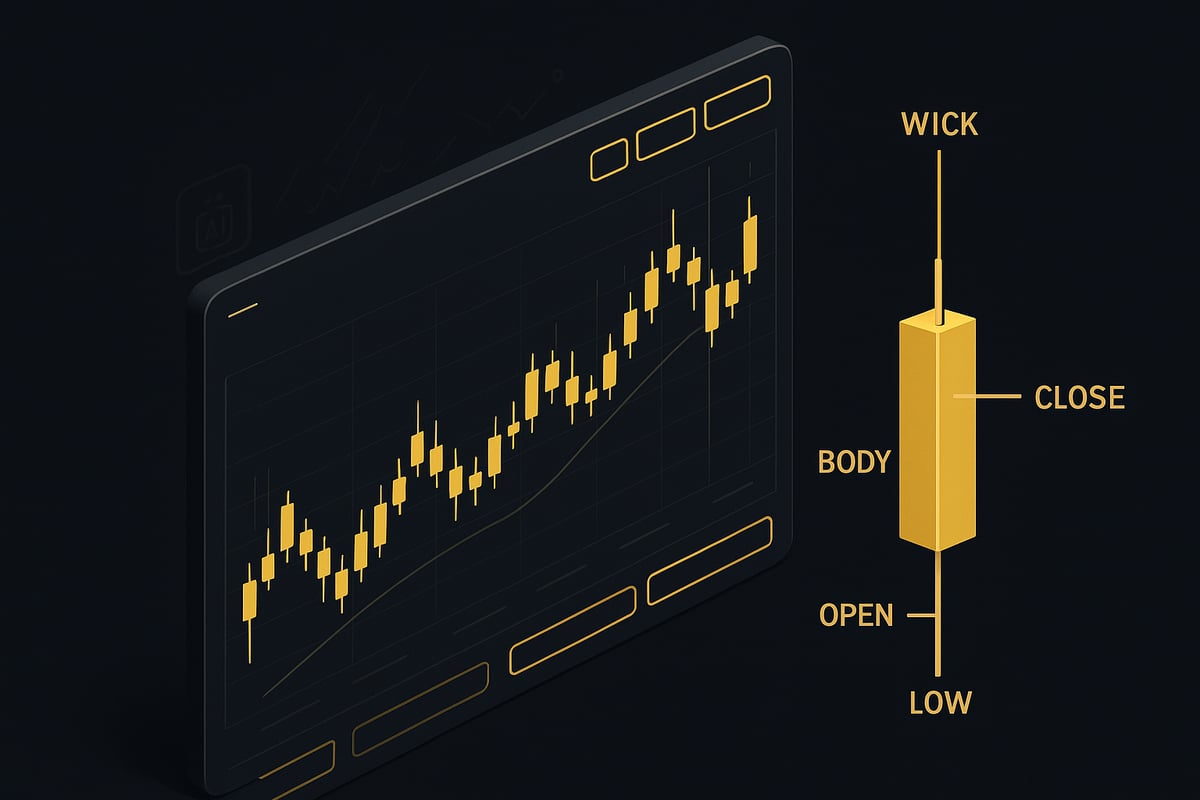
Candlestick indicators are graphical representations of price movements, first developed by Japanese rice traders centuries ago. Each candlestick captures the open, high, low, and close prices for a given period, providing a snapshot of market sentiment.
In today’s trading world, candlestick indicators are used across forex, stocks, crypto, and indices. Their visual nature helps traders quickly interpret shifts in supply and demand. One candle can reveal if buyers controlled the session, if sellers stepped in, or if indecision ruled the market.
The relevance of candlestick indicators continues into 2025, as traders seek fast, reliable ways to read price action. For example, a single bullish candle after a downtrend may signal renewed buying interest. Decades of research, such as the findings in the 40 Years of Candlestick Pattern Success Rates analysis, reinforce the enduring effectiveness of these patterns.
Core Components of a Candlestick
Understanding the anatomy of candlestick indicators is crucial for accurate analysis. Each candlestick consists of a body and upper/lower wicks (also called shadows). The body shows the range between the open and close, while the wicks represent the extremes of price movement.
| Component | Description |
|---|---|
| Body | Distance from open to close, shows bullish or bearish |
| Wick | High/low points, signal price rejection or momentum |
| Color | Green for bullish, red for bearish (standard coloring) |
Bullish candles close higher than they open, while bearish candles close lower. The size of candlestick indicators often hints at volume and volatility; a long wick might signal strong rejection at a price level.
For instance, if a candle has a long upper wick, it suggests buyers pushed prices up but sellers quickly regained control. Over 70% of professional traders rely on candlestick indicators for their trade decisions, according to TradingView user polls.
Types of Candlestick Indicators
Candlestick indicators come in many forms. Single-candle patterns, like the doji, reveal indecision, while multi-candle patterns, such as engulfing or morning star, indicate trend reversals or continuations.
There are two main categories: pattern-based (e.g., engulfing, doji) and trend-based (e.g., trend bars). Modern platforms like TradingView offer automated tools that detect these patterns in real time, helping traders spot opportunities faster.
Inside and outside bar indicators are especially useful for analyzing volatility. As AI-driven tools become more common, traders can automate the process of scanning for candlestick indicators, saving time and improving consistency.
Why Candlestick Patterns Matter in Modern Trading
Candlestick indicators offer unique psychological insights, capturing crowd behavior and market emotion in a single glance. With the speed of information in 2025, visual cues from candlestick indicators help traders react without delay.
Candlestick indicators also integrate seamlessly with algorithmic and AI trading systems. For example, patterns can filter out market noise, highlighting only the most relevant price action.
Combining candlestick indicators with other technical tools, such as moving averages or volume analysis, increases their reliability. The ability to quickly interpret these signals is essential for traders seeking an edge in fast-moving markets.
Essential Bullish and Bearish Candlestick Patterns
Recognizing the most impactful candlestick indicators is fundamental for effective trading in 2025. By mastering classic bullish and bearish patterns, traders gain a powerful toolkit for identifying potential market turning points, trend continuations, and high-probability setups. Let us explore the patterns every trader should know, how to spot them, and why they matter in today’s fast-moving markets.
Bullish Patterns Every Trader Should Know
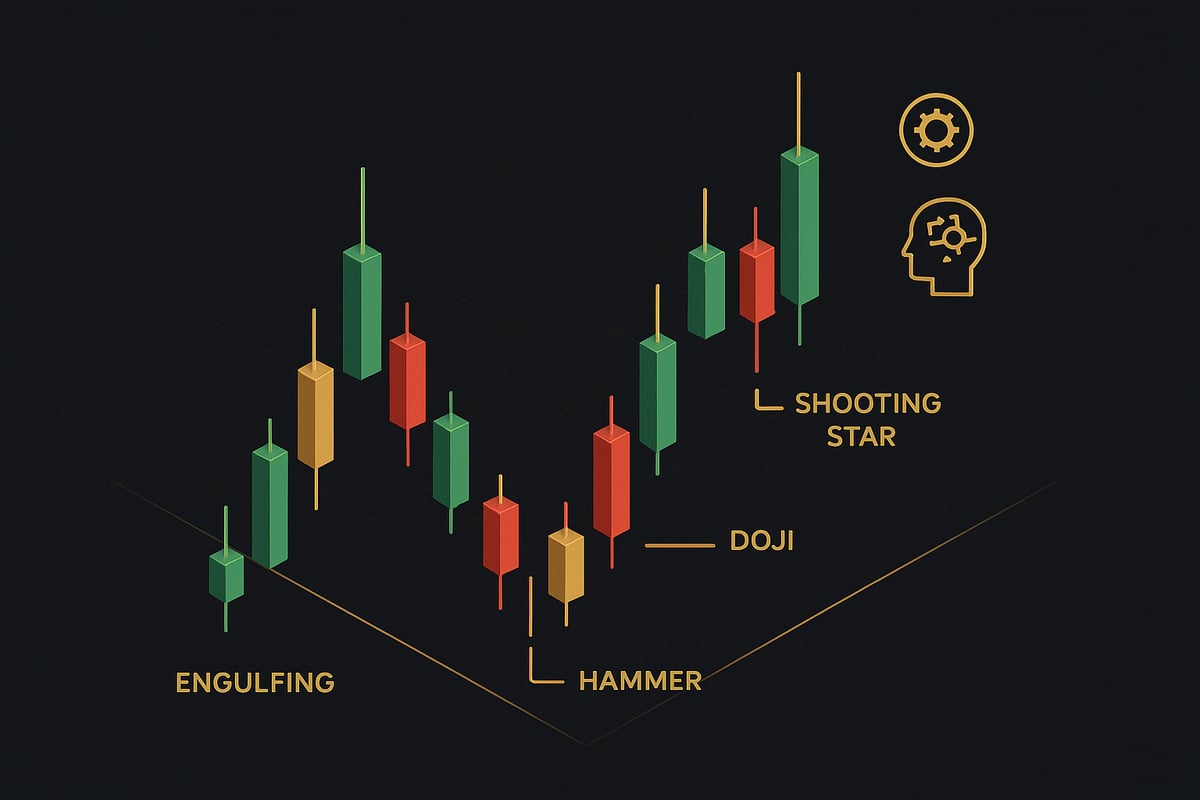
Bullish candlestick indicators signal potential upward reversals or trend continuations. The bullish engulfing pattern, for example, occurs when a green candle fully engulfs the prior red candle, indicating strong buyer momentum. This pattern is highly valued across all markets, with a 63% historical success rate in short-term reversals, according to TradingView analysis.
The hammer and inverted hammer are single-candle formations that appear after a downtrend. A hammer features a small body and a long lower wick, signaling buyers stepping in after sellers pushed prices down. The morning star is a multi-candle pattern that marks a shift from bearish to bullish sentiment, often preceding sustained rallies.
For a deeper dive into these formations, the Bullish candlestick patterns guide provides detailed visuals and trading insights.
Spotting these bullish candlestick indicators early can significantly improve trade win rates. Traders should always confirm patterns with volume or trend analysis to filter out false signals.
Bearish Patterns for Downtrend Detection
Bearish candlestick indicators help identify when an uptrend is losing steam or a new downtrend is emerging. The bearish engulfing pattern stands out, as it occurs when a large red candle completely engulfs the previous green candle, signaling increasing selling pressure.
The shooting star is another crucial pattern, recognized by a small body near the session low and a long upper wick. This shows buyers lost control after an initial push higher. The hanging man, which looks similar to a hammer but appears at a market top, also warns of potential reversals. Finally, the evening star is a three-candle formation that often precedes strong downward moves.
Bearish candlestick indicators frequently appear before high-volume sell-offs, offering traders a chance to manage risk or enter short positions. Real examples, such as bearish engulfing signals on the S&P 500, highlight the predictive power of these formations.
Reversal and Continuation Patterns
Certain candlestick indicators excel at revealing market indecision or signaling breakouts. The doji, which forms when open and close prices are nearly identical, represents a tug-of-war between buyers and sellers. This often leads to a reversal or strong continuation, depending on the context.
Inside and outside bars are multi-candle patterns used to gauge volatility and breakout potential. An inside bar occurs when the current candle is fully contained within the range of the previous candle, indicating price compression. Conversely, an outside bar engulfs the prior candle, hinting at a possible breakout.
Tweezer tops and bottoms are double-candle reversals, identified by matching highs or lows over two sessions. These candlestick indicators are favored by both day and swing traders for their reliability in volatile markets.
Advanced Pattern Recognition in 2025
The landscape for candlestick indicators is evolving rapidly. AI-driven tools and automated scripts now scan charts for qualifying patterns based on strict quantitative rules, such as body-to-wick ratios and volume thresholds.
For example, automated systems can flag extreme reversal setups, freeing traders from manual chart scanning. According to TradingView user feedback, automated pattern recognition boosts trading efficiency by 40 percent. However, some traders still prefer manual analysis for added context and intuition.
Both approaches have merit. Automated detection excels at speed and consistency, while manual analysis can better adapt to unique market conditions. In 2025, blending these methods ensures traders make the most of candlestick indicators in any environment.
Integrating Candlestick Indicators with Modern Trading Tools
Modern traders need tools that keep pace with fast-moving markets. Integrating candlestick indicators with advanced technology can dramatically improve both reaction speed and decision-making accuracy. Let us explore how automation, trend analysis, breakout strategies, and multi-timeframe confirmation are transforming the use of candlestick indicators in 2025.
The Role of Automated Candlestick Scanners
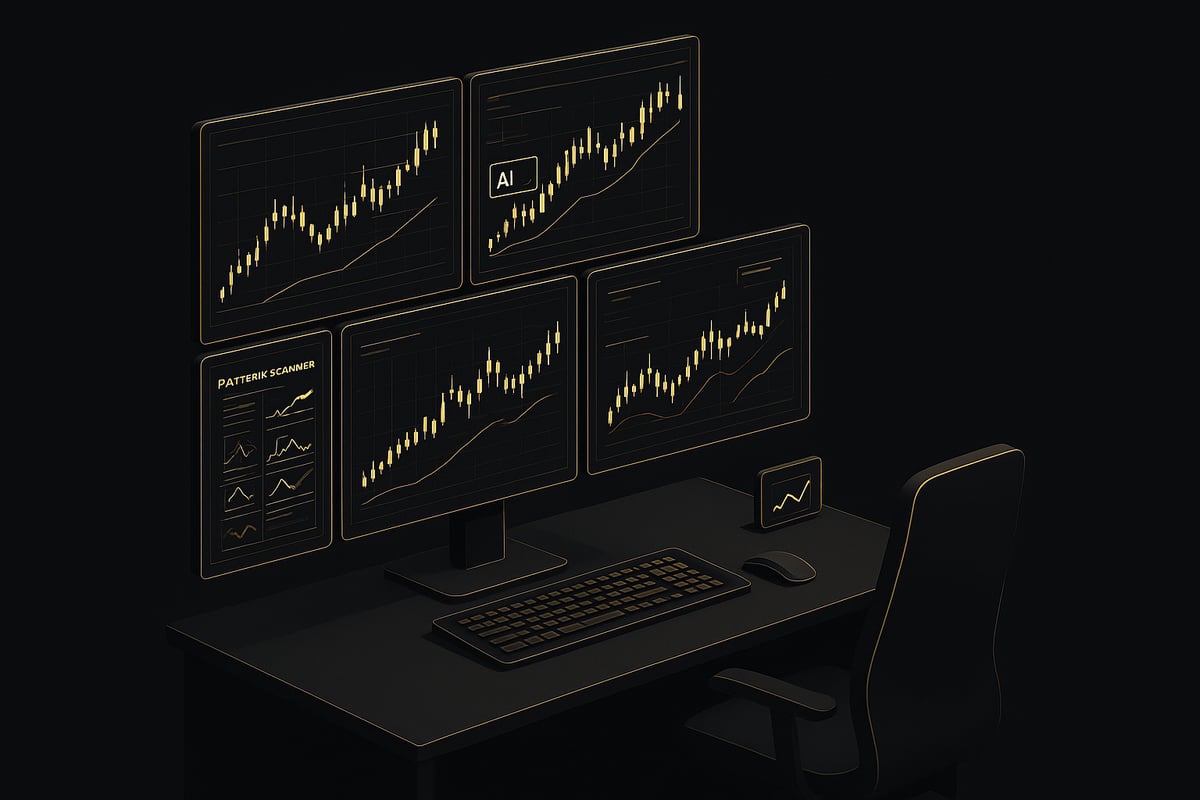
Automated candlestick scanners have become indispensable for traders who want to capitalize on every opportunity. These tools scan dozens of charts simultaneously, flagging high-probability setups based on candlestick indicators.
Platforms like TradingView offer real-time alerts for specific patterns, allowing traders to react instantly when a bullish reversal or bearish engulfing appears. Customizable alerts help focus on the patterns that matter most to your strategy. For example, a trader can set alerts for a bullish wick reversal across multiple timeframes or assets.
Data shows that 80 percent of active traders now rely on automated alerts for candlestick indicators, which significantly reduces the chance of missing key trades. This level of automation brings discipline and speed to modern trading.
Combining Candlestick Indicators with Trend Analysis
Pairing candlestick indicators with trend analysis creates a robust trading framework. Trend bars, for instance, help confirm whether a detected pattern aligns with the prevailing market direction.
When a candlestick pattern forms in the direction of the trend, the probability of a successful trade increases. For example, a Price Action Trend Bar indicator can highlight whether buyers or sellers are in control, providing crucial context for interpreting candlestick indicators.
Traders often use trend analysis to filter out lower-quality signals. Patterns that occur during established trends are statistically more likely to deliver favorable outcomes, making this integration essential for consistent results.
Candlestick Patterns and Breakout Strategies
Breakout strategies thrive on volatility, and candlestick indicators are key to spotting high-potential setups. Inside Bar zones, in particular, signal price compression and reveal where breakouts are likely to occur.
Modern breakout scanners analyze candle levels to score trends and identify optimal entry points. Tools like Smart Inside Bar Zones visualize these breakout regions, helping traders react quickly to shifts in momentum.
For those seeking a deeper dive into reversal and breakout setups, Reversal candlestick pattern strategies offer actionable insights and practical methods to enhance trade timing. Using candlestick indicators in this way can yield above-average returns, especially in volatile markets.
Multi-Timeframe Analysis for Confirmation
Multi-timeframe analysis is a cornerstone of successful trading with candlestick indicators. Aligning signals across different timeframes helps filter out noise and reduces the risk of false entries.
Specialized tools allow traders to visualize candlestick levels from higher timeframes directly on lower timeframe charts. For instance, a Breakout Scanner might display trend agreement across four or more timeframes, providing an added layer of confidence before entering a trade.
This approach ensures that candlestick indicators are not viewed in isolation. Instead, traders gain a comprehensive view of the market, leading to more accurate and reliable decisions.
How Adaptive Tools Like PipTrend Enhance Candlestick Trading
adaptive platforms such as PipTrend represent the next evolution in candlestick indicators. PipTrend analyzes every price candle in real time, detecting patterns and trends with remarkable precision.
Traders receive instant alerts when optimal buy or sell conditions are met, thanks to the platform’s multi-timeframe analysis and seamless integration with TradingView. PipTrend reduces the guesswork inherent in manual analysis, making candlestick indicators more accessible and actionable for both beginners and professionals.
By leveraging AI, traders can focus on strategy execution rather than pattern detection, turning candlestick indicators into a true competitive edge.
Step-by-Step: Building a Winning Candlestick Trading Strategy
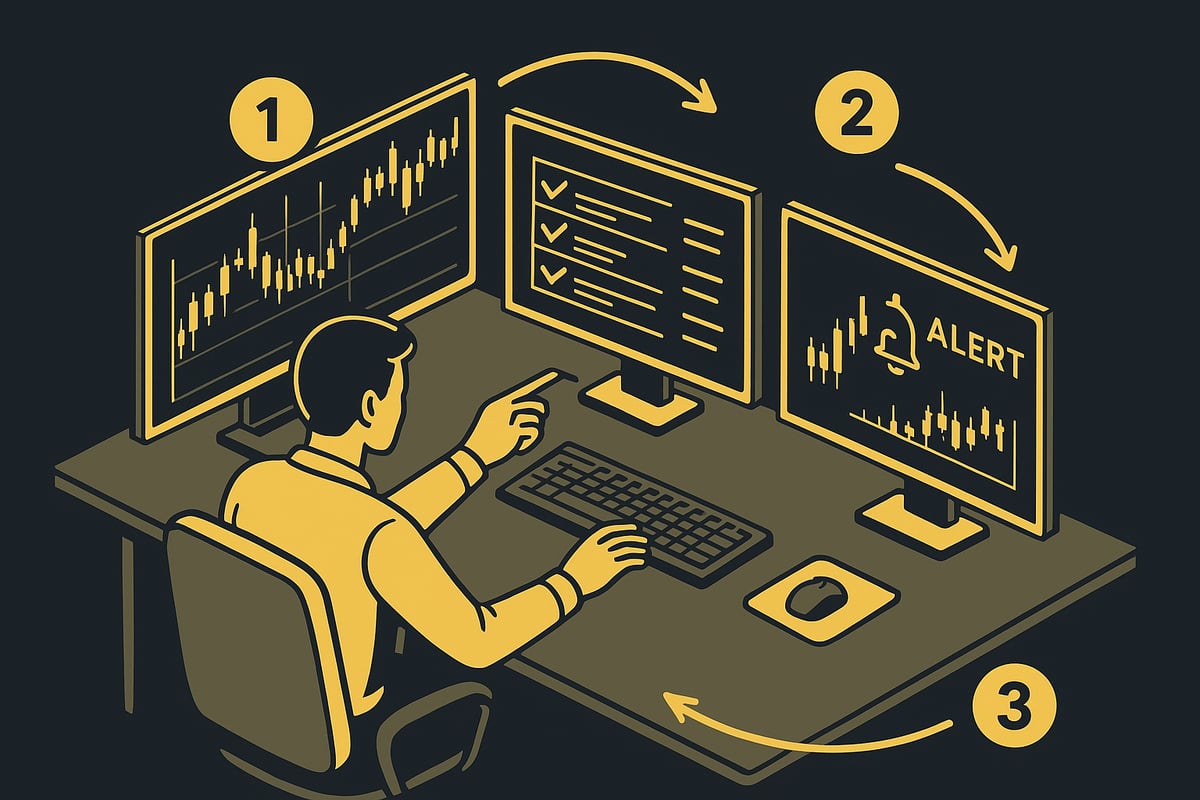
Building a robust trading strategy with candlestick indicators requires a systematic approach. By following these practical steps, traders can transform chart patterns into actionable, evidence-based decisions. Each step is designed to help you adapt to modern markets, reduce risk, and increase your confidence in every trade.
Step 1: Define Your Trading Goals and Market
Start by clarifying your trading objectives and the markets you want to trade. Are you aiming for quick day trades, medium-term swing trades, or long-term positions? Each style demands specific tactics and time commitments. Next, decide which markets best align with your expertise, forex, crypto, stocks, or indices.
For example, day trading NASDAQ requires rapid decision-making, while swing trading EUR/USD focuses on capturing broader moves. Matching your goals to the right market is essential. Candlestick indicators should fit your risk tolerance and lifestyle, not the other way around. By defining these parameters early, you set a strong foundation for discipline and consistency.
Step 2: Choose Relevant Candlestick Patterns
Focus on a select group of high-probability candlestick indicators that suit your chosen market. Avoid overwhelming yourself with dozens of patterns. Instead, master a few, such as engulfing, doji, or inside bars, and use them consistently. Historical data helps validate which patterns deliver reliable signals in your specific asset class.
For instance, forex traders may lean on engulfing and doji patterns, while crypto traders find inside bars particularly effective. To reinforce your approach with solid evidence, consider reviewing studies like Profitable candlestick trading strategies, The evidence from a new perspective, which analyzes the real-world performance of candlestick indicators. Consistency in pattern selection leads to greater confidence and clarity.
Step 3: Integrate Confirmation Tools
Relying solely on candlestick indicators can increase the risk of false signals. Enhance your strategy by combining patterns with confirmation tools like trend indicators, moving averages, or volume analysis. For example, pairing a hammer pattern with a moving average crossover can filter out weak setups.
Automated alerts can also help by notifying you when both a pattern and a confirmation signal align. Studies show that integrating these tools with candlestick indicators improves trade accuracy by 25 percent. This method reduces guesswork, allowing you to focus on high-quality setups and avoid impulsive trades.
Step 4: Set Entry, Exit, and Risk Management Rules
Establish clear rules for entering and exiting trades based on your chosen candlestick indicators and confirmation signals. Define your entry trigger, such as a bullish engulfing candle confirmed by volume. Set your stop-loss at logical levels, like just below the wick for bullish reversals, to protect your capital.
Determine profit targets using recent support or resistance zones. Some traders use the Average True Range (ATR) to set dynamic stops and targets. By codifying your risk management rules, you ensure that every trade has a plan. This discipline prevents emotional decisions and supports long-term profitability.
Step 5: Backtest and Optimize Your Strategy
Before risking real money, rigorously backtest your strategy using historical charts and automated scripts. Analyze performance metrics such as win rate, risk-reward ratio, and drawdown. For example, backtesting a bullish engulfing pattern on EUR/USD data from 2023 to 2024 can reveal its true edge.
Use the insights gained to refine your rules and improve consistency. Empirical research on candlestick indicators, like peer-reviewed studies, demonstrates that backtesting is essential for validation. This process helps you adapt your strategy to different market conditions and avoid costly mistakes.
Step 6: Go Live with Real-Time Monitoring and Adjustments
Begin trading live with small position sizes to minimize risk while you gain experience. Use automated scanners and alerts to monitor your setups in real time, ensuring you never miss a qualifying trade. As you gather more data, stay flexible and adjust your strategy based on current market volatility or evolving patterns.
For example, you might tighten your pattern confirmation criteria during periods of high volatility. The ongoing refinement of your approach, grounded in candlestick indicators, helps you stay adaptive. Continuous monitoring and disciplined adjustments are key to long-term trading success.
Advanced Candlestick Techniques for 2025
As trading technology evolves, mastering advanced techniques with candlestick indicators is more important than ever. In 2025, traders must combine data-driven insights, cross-market applications, and adaptive strategies to stay ahead. Let’s explore how to elevate your candlestick indicators approach with precision, quantitative analysis, and real-world expertise.
Quantitative Pattern Filtering and Rule-Based Setups
Modern traders rely on objective rules to filter signals from candlestick indicators. By setting quantitative conditions, such as minimum body-to-bar ratios or specific wick lengths, you can reduce subjectivity and increase repeatability. For instance, a bullish reversal might require a hammer with a body less than 30% of the total range and a lower wick at least twice the body size.
if (body/total_range < 0.3) and (lower_wick/body > 2):
    print("Valid hammer reversal")
These rule-based setups help automate pattern recognition and align with findings in Candlestick Analysis - Statistics I, where historical data reveals which candlestick indicators offer the best statistical edge.
Multi-Asset and Cross-Market Pattern Application
Candlestick indicators are not limited to one market. Applying them across forex, crypto, stocks, and commodities reveals strengths and weaknesses unique to each asset class. For example, engulfing patterns may be more reliable in trending crypto markets, while doji signals often highlight reversals in major stock indices.
| Asset Class | Pattern Effectiveness | Volatility | Reliability |
|---|---|---|---|
| Forex | Moderate | Medium | High |
| Crypto | High | High | Moderate |
| Stocks | Moderate | Low | High |
| Commodities | Variable | Medium | Variable |
By testing candlestick indicators on multiple assets, you can develop strategies that adapt to market-specific dynamics and volatility.
Integrating Volume and Volatility Analysis
To strengthen signals from candlestick indicators, integrate volume spikes and volatility measures. A hammer pattern, for example, carries more weight when accompanied by above-average volume, signaling strong market conviction behind the reversal. Volatility indicators like ATR can help confirm whether a breakout or reversal is likely to sustain.
Pairing candlestick indicators with volume and volatility data filters out weak setups and highlights trades with the highest probability of follow-through. This integrated approach is essential for traders seeking confirmation beyond price action alone.
Adaptive Strategies for Algorithmic and AI-Driven Markets
The landscape for candlestick indicators is rapidly changing as AI and algorithmic trading become mainstream. Algorithms now recognize and react to common patterns, making it crucial for traders to evolve their strategies. Adaptive systems use machine learning to update pattern parameters, ensuring that candlestick indicators remain effective as market conditions change.
For a comprehensive overview of the latest research and future trends, review the Candlestick Pattern Research Analysis, Future and Beyond: A Systematic Literature Review Using PRISMA. Staying informed and flexible is key to long-term profitability with candlestick indicators.
Common Pitfalls and How to Avoid Them
Even experienced traders can fall into traps when using candlestick indicators. Overfitting historical data, ignoring market context, and neglecting confirmation signals are frequent mistakes. False signals are especially common during news-driven volatility.
To avoid these pitfalls:
- Stick to rule-based setups
- Always seek confirmation from trend, volume, or volatility tools
- Continuously backtest and adjust your approach
Discipline and a commitment to ongoing learning will help you harness the full potential of candlestick indicators in 2025.
Candlestick Indicators: Trends, Innovations, and the Future
As trading technology evolves, candlestick indicators remain at the forefront of market analysis. Looking ahead to 2025, traders must adapt to new tools, smarter automation, and the growing influence of AI. Mastering these trends ensures you stay ahead in a fast-moving financial landscape.
Emerging Trends in Candlestick Analysis
The landscape of candlestick indicators is rapidly shifting. adaptive pattern detection now dominates many trading platforms, offering real-time alerts and adaptive learning capabilities. Traders are integrating social sentiment and alternative data to supplement traditional price action analysis.
For example, the TradingView community has seen a surge in open-source candlestick scripts, making advanced tools accessible to all. In 2024 and 2025, over 60 percent of new trading indicators released included AI components, reflecting the market’s appetite for innovation. These trends are reshaping how traders interpret candlestick indicators and respond to market signals.
Innovations in Candlestick Indicator Tools
Modern candlestick indicators are more versatile than ever. Customizable visualization features allow traders to tailor their analysis, whether on desktop, mobile, or web platforms. Many new tools combine candlestick, trend, and volume information into a single, streamlined indicator.
Consider a tool that overlays trend strength and volume spikes directly on candlestick charts. This integration reduces clutter and highlights actionable signals at a glance. User-driven development and community sharing are accelerating the pace of innovation, allowing traders to influence which features matter most in candlestick indicators.
| Innovation | Impact on Trading |
|---|---|
| adaptive alerts | Faster decision making |
| Multi-data integration | Richer market context |
| Cross-platform compatibility | Flexibility and mobility |
The Evolving Role of Candlestick Patterns in 2025 Markets
Market dynamics are changing, with increased speed and complexity driven by algorithmic trading. Candlestick indicators are adapting, providing traders with essential visual cues amid the noise. Adaptability and continuous learning have become vital for success.
Institutional algorithms now interact with retail traders’ pattern-based strategies, creating new opportunities and risks. Combining human insight with automated candlestick indicators gives you a competitive edge. For those looking to deepen their understanding of bearish signals, explore Bearish candle patterns explained for a comprehensive breakdown.
Resources for Ongoing Mastery
Staying current with candlestick indicators means leveraging the best platforms and educational resources. TradingView and MetaTrader remain top choices for advanced charting and automated pattern detection. Books, courses, and online communities are essential for broadening your expertise.
For instance, TradingView’s script library offers automated tools for mastering candlestick indicators. To dig deeper into specific patterns, such as the hammer, review the Hammer candlestick pattern analysis for actionable insights. Lifelong learning is your greatest asset as you navigate the evolving world of trading.
Now that you’ve explored how mastering candlestick indicators can give you a clear edge in today’s fast-paced markets, it’s time to put that knowledge into action. With PipTrend, you don’t have to second guess your trades or spend hours searching for the right patterns, the AI-driven platform analyzes every price move for you and delivers real-time, easy-to-understand signals across forex, crypto, stocks, and indices. Whether you’re refining your strategy or just starting out, you deserve tools that support confident, consistent trading.
Start Catching Winning Trades, Right Now!
Risk Disclaimer: Trading involves risk. Past performance doesn't guarantee future results. Only trade with money you can afford to lose. PipTrend is a tool to assist your trading decisions, not financial advice.