ATR Indicator Guide: Mastering Volatility in 2026
On this page
In 2026’s fast-moving markets, volatility presents both risk and opportunity. Will you master it, or will you fall victim to its unpredictability?
Managing volatility has never been more crucial for traders across forex, stocks, crypto, and indices. The atr indicator stands out as a reliable, time-tested tool for making sense of market swings.
With the right approach, you can leverage ATR for smarter entries, exits, and dynamic risk control. This guide will show you how.
We will cover the origins and calculation of ATR, practical trading techniques, advanced strategies, and common mistakes to avoid. By the end, you will be ready to use ATR confidently to navigate volatility in 2026.
Understanding the ATR Indicator: Origins, Purpose, and Core Concepts
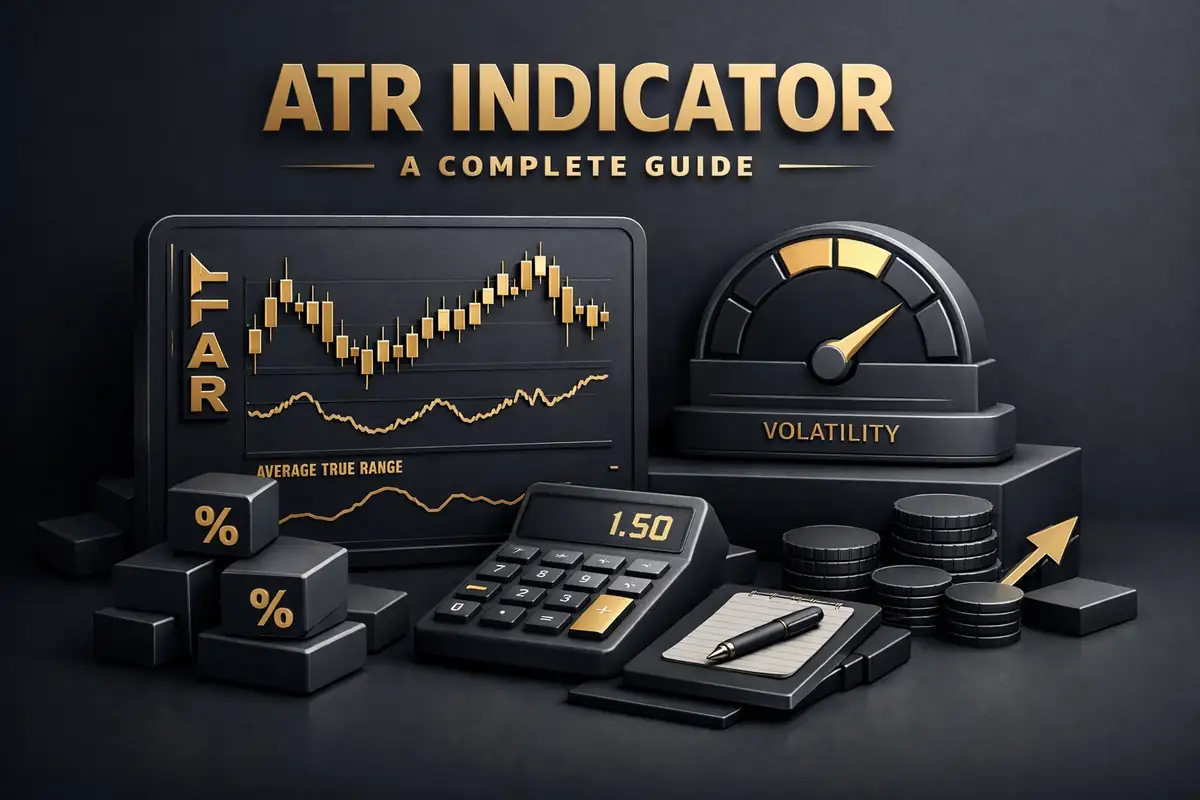
The atr indicator has stood the test of time, evolving from its roots in commodity trading to become a cornerstone of modern market analysis. Its ability to quantify volatility has made it essential for traders navigating unpredictable price swings across asset classes.
The History and Development of ATR
The atr indicator was developed by J. Welles Wilder Jr. in 1978, debuting in his influential book “New Concepts in Technical Trading Systems.” Originally, Wilder designed the atr indicator to help commodity traders manage the unpredictable swings in futures markets. Over time, its value became apparent to traders in forex, stocks, crypto, and indices.
Wilder’s suite of indicators, including ATR, RSI, ADX, and Parabolic SAR, transformed technical analysis. The atr indicator, in particular, filled a gap by providing a clear, objective measure of volatility, not just trend or momentum.
As trading platforms evolved, the atr indicator became a standard feature. Today, it is seamlessly integrated into charting tools like TradingView and MetaTrader, allowing traders to access real-time volatility readings with a few clicks.
What the ATR Measures, and What It Doesn’t
At its core, the atr indicator is a non-directional gauge of market volatility. It measures the magnitude of price movement, often called market “noise,” but does not indicate whether prices will rise or fall. This objectivity sets it apart from trend-following or momentum indicators.
Unlike standard deviation or Bollinger Bands, which rely on statistical dispersion, the atr indicator simply reflects the average range between high and low prices over a set period. Volume indicators measure trading activity, not price range, making ATR unique.
ATR is classified as a lagging indicator, meaning it responds to past price action. This lag can be both a strength and a limitation. It smooths out noise, but it may react slowly to sudden volatility spikes. For a detailed breakdown of what the atr indicator measures and how it is calculated, the Average True Range Indicator guide offers additional insights.
| Indicator | Measures | Directional? | Lagging? |
|---|---|---|---|
| ATR | Price range (volatility) | No | Yes |
| Bollinger Bands | Price + volatility | No | Yes |
| RSI | Momentum | Yes | Yes |
| Volume | Trading activity | No | No |
Why Volatility Matters in 2026
In 2026, the atr indicator is more valuable than ever. Algorithmic trading and rapid news cycles have amplified market volatility across all asset classes. Sudden price swings, triggered by geopolitical events, economic data, or holiday liquidity gaps, are now the norm, not the exception.
The atr indicator empowers traders to adapt to these shifting regimes. Whether trading forex, crypto, stocks, or indices, understanding real-time volatility is essential for timing entries and exits, sizing positions, and managing risk.
For example, during major news releases, the atr indicator often spikes, signaling increased opportunity but also greater risk. In quieter periods, a low ATR reading can indicate consolidation or a lull before the next big move. By monitoring the atr indicator, traders gain a crucial edge in today’s fast-moving markets.
How the ATR Indicator is Calculated: Step-by-Step Guide
Understanding how the atr indicator is calculated is essential for mastering volatility. This section breaks down each calculation step, so you can confidently interpret ATR readings in any market.
Breaking Down the ATR Formula
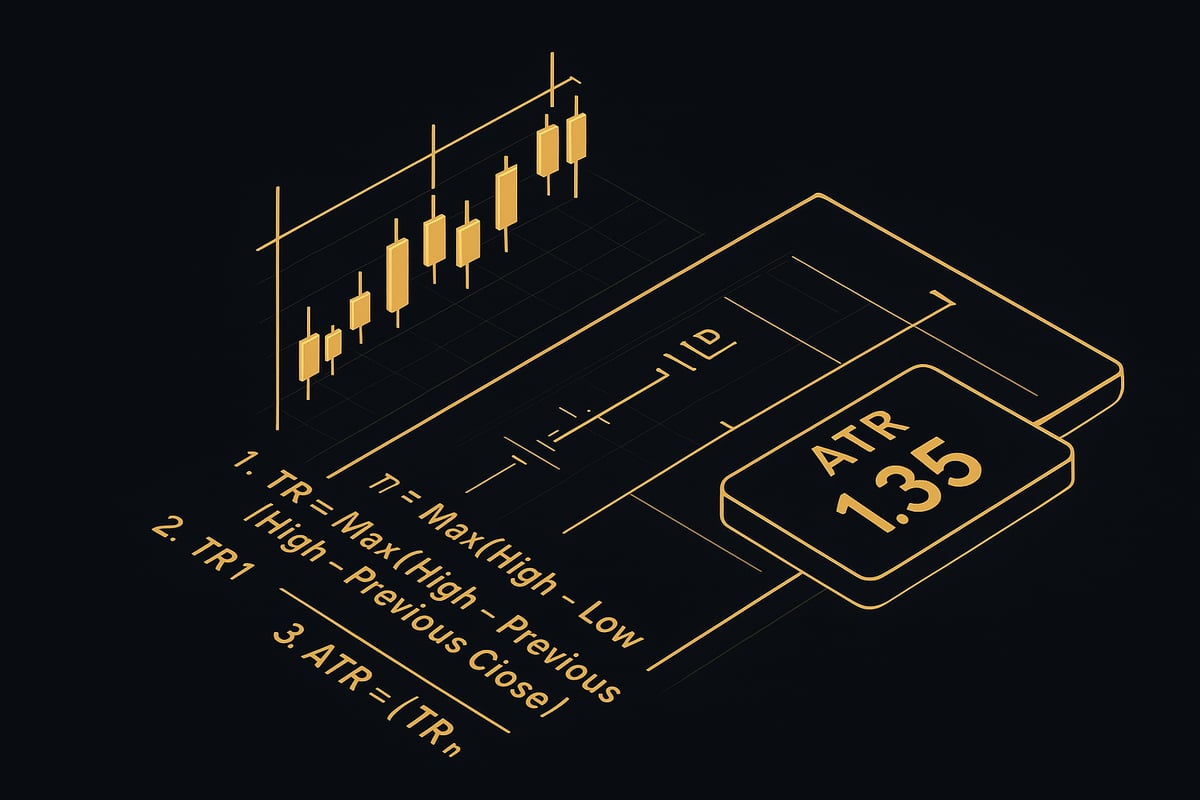
The atr indicator uses a smoothing formula to provide a dynamic measure of market volatility. The standard calculation is:
ATR = (Previous ATR × (n 1) + TR) nIn this formula, “n” is the number of periods, typically set to 14 by default. This period is popular because it balances responsiveness with reliability, avoiding excessive noise. The formula calculates the current ATR by combining the previous value with the latest true range, then dividing by the period. For a deeper dive into these formulas and their practical application, you can consult this Average True Range (ATR): Definition, Formula, How to Use resource.
Understanding True Range (TR)
True Range, or TR, is at the heart of the atr indicator calculation. It captures the most significant price movement within a period by considering three possible values:
- Current high minus current low
- Absolute value of current high minus previous close
- Absolute value of current low minus previous close
The largest of these three values for each period is chosen as the true range. This method ensures that price gaps and overnight volatility are not ignored, giving a more accurate reading of real price movement.
Example Calculation Walkthrough
Let us walk through an example using forex price data. Imagine EUR/USD has the following daily values:
| Day | High | Low | Close (prev) |
|---|---|---|---|
| 1 | 1.1050 | 1.1000 | 1.1020 |
Step 1: Calculate TR
- High Low: 1.1050 1.1000 = 0.0050
- High Prev Close: |1.1050 1.1020| = 0.0030
- Low Prev Close: |1.1000 1.1020| = 0.0020
TR = 0.0050 (largest value)
To calculate a 14-period ATR, repeat this for 14 days, average the TRs for the first ATR, then use the formula above for subsequent periods. The atr indicator will display these values in pips, points, or dollars, depending on your asset and platform.
Customizing ATR Settings
Traders can tailor the atr indicator period to fit their style. Day traders may choose a shorter period, such as 7, to catch quick volatility changes, while swing traders often stick with 14 or extend to 21 for smoother readings. Shorter periods make ATR more sensitive to price swings but can introduce noise. Longer periods provide greater stability but may lag in fast-moving markets. Most trading platforms, like TradingView and MT4, allow for easy adjustment of ATR settings to suit your approach.
Practical Tips and Mistakes to Avoid
When using the atr indicator, avoid common calculation errors. Double-check that your data feed is clean and free from missing bars or price spikes, as these can distort your ATR value. Always use consistent settings across charts and platforms to ensure comparability. Remember, ATR is a lagging indicator, so do not expect it to forecast sudden volatility spikes. Instead, use it as a guide to current market conditions and adjust your trading plan accordingly.
Interpreting and Using ATR in Real Trading Scenarios
Understanding how to interpret and deploy the atr indicator in live markets is essential for traders who want to navigate volatility confidently. The atr indicator offers unique insights into market behavior, helping you distinguish between quiet consolidation and explosive moves.
Reading ATR Values: Highs, Lows, and What They Mean
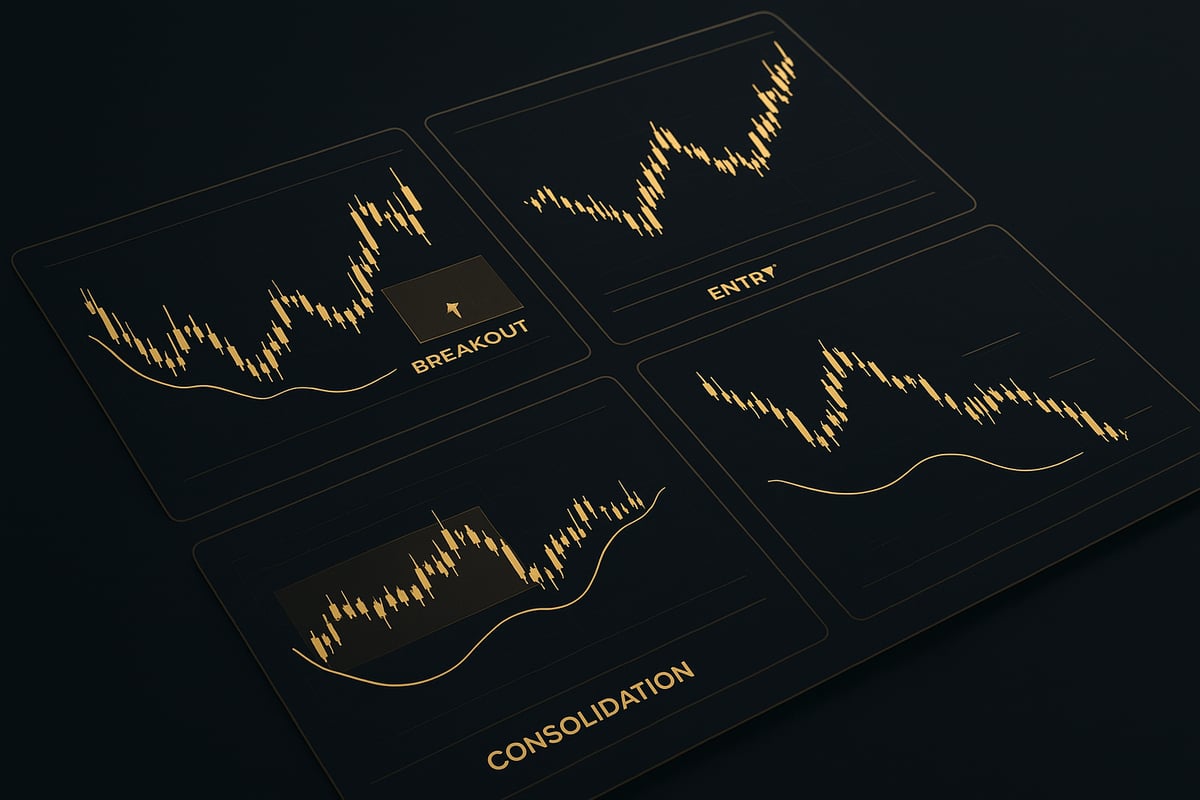
The atr indicator measures the magnitude of price movement, not its direction. High atr indicator readings signal increased volatility, often appearing during news releases or after significant economic data. This can mean the market is primed for breakouts or sharp reversals.
Conversely, low atr indicator values typically coincide with periods of consolidation or low trading volume. These quieter phases often precede major price moves, making them critical for patient traders. For example, during major holidays, both forex and crypto markets frequently display reduced atr indicator values, warning of limited opportunities.
A simple table can help clarify:
| ATR Level | Market State | Typical Scenario |
|---|---|---|
| High | Volatile | News, breakouts |
| Medium | Trending | Healthy trends |
| Low | Range-bound | Holidays, consolidation |
ATR in Context: Combining with Price Action and Other Indicators
While the atr indicator is powerful, it should never be used in isolation. Combining it with price action or trend-following indicators provides a clearer market picture. For instance, rising ATR combined with a breakout candle can confirm momentum, while falling ATR might signal trend exhaustion or consolidation.
Many traders layer the atr indicator with moving averages, RSI, or volume to filter out false signals. Using ATR as a filter, you might choose to only enter trades when volatility exceeds a certain threshold, reducing the risk of whipsaws. For a deeper dive into these practical combinations, see Master the Average True Range (ATR) Indicator.
Adapting to Market Conditions in 2026
The trading landscape in 2026 is shaped by rapid information flow, algorithmic strategies, and unpredictable geopolitical events. The atr indicator remains relevant by helping traders adapt their tactics to shifting volatility regimes.
When algorithms react instantly to news, ATR readings can spike within minutes. Skilled traders use the atr indicator to adjust stop-losses, position sizes, and even trade frequency in response to these changes. Monitoring ATR across different assets, such as forex, stocks, and crypto, allows for a more robust risk management approach in fast-moving markets.
Practical Chart Examples
Visualizing the atr indicator in action can help solidify its role in decision-making. On a trending chart, ATR will often rise as price accelerates, confirming momentum. During sideways markets, ATR flattens, indicating a lack of directional conviction.
- In a breakout scenario, a sudden ATR surge confirms increased participation.
- During consolidation, low ATR warns of limited profit potential.
- After major news, ATR can remain elevated, suggesting ongoing volatility.
Many platforms allow traders to overlay ATR on charts, making it easier to spot these shifts and adapt strategies accordingly.
Limitations and Common Misconceptions
It is crucial to recognize what the atr indicator does not do. ATR does not predict price direction or generate entry and exit signals by itself. Misinterpreting ATR as a forecasting tool can lead to costly mistakes.
Over-reliance on the atr indicator, especially without considering broader market context or other indicators, can result in false confidence. Remember, ATR is a lagging indicator, reflecting past volatility rather than anticipating future moves. Always ensure clean data feeds and avoid applying ATR to illiquid or highly gapped assets, as this can skew readings and mislead your strategy.
ATR-Based Trading Strategies: Step-by-Step Implementation
Mastering the art of volatility management in 2026 starts with practical techniques for the atr indicator. Whether you are day trading forex, swing trading stocks, or diversifying in crypto, these strategies will help you apply the atr indicator for smarter risk control and trade execution.
Using ATR for Dynamic Stop-Loss and Take-Profit Placement
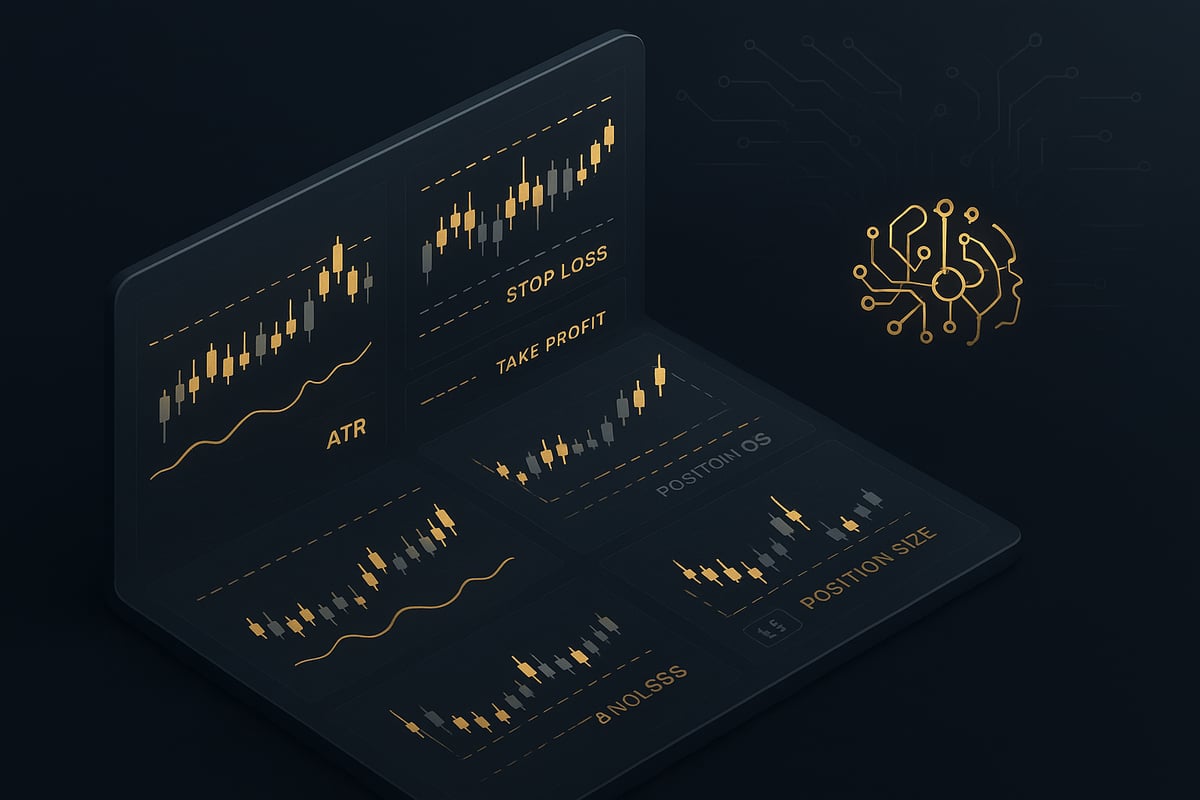
The atr indicator excels at adapting stop-loss and take-profit levels to current market volatility. Instead of using static pip or point distances, traders multiply the current ATR value by a chosen factor for tailored risk controls. For example, a stop-loss might be set at 1.5x the ATR, allowing more room in volatile markets and tightening risk when conditions calm.
Consider this formula:
Stop-Loss = Entry Price ± (ATR × Multiplier)Trailing stops based on the atr indicator help lock in profits as trends develop. This dynamic approach reduces premature stop-outs and adjusts targets as volatility shifts, offering a responsive framework for both forex and crypto markets.
Position Sizing with ATR
Proper position sizing is essential for managing risk, and the atr indicator provides an objective foundation. By standardizing trade size relative to volatility, traders can avoid oversized losses during wild markets. The basic formula is:
Position Size = Risk per Trade / (ATR × Multiplier)For a deeper dive into this method and examples across asset classes, explore Position sizing using ATR. Applying the atr indicator in this way ensures consistent exposure, regardless of market turbulence.
ATR as a Volatility Filter for Trade Entries
Filtering trades with the atr indicator helps avoid choppy or stagnant markets. Many systems only trigger entries when ATR rises above a set threshold, signaling increased volatility and a higher probability of meaningful breakouts.
For instance, a breakout strategy might only allow trades when the atr indicator exceeds its 20-period average. This approach filters out false signals, focusing on periods when price is more likely to trend and reducing exposure to whipsaws.
ATR for Trade Exits and Profit Protection
The atr indicator is not just for entries, it is equally powerful for managing exits. A declining ATR often signals market consolidation, which may prompt traders to take profits or tighten stops. Combining ATR-based trailing stops with exit signals helps capture gains during strong moves and minimize giveback when volatility shrinks.
For intraday traders, monitoring the atr indicator can indicate when momentum is fading, supporting timely exits before reversals or stagnation erode profits.
Integrating ATR with Multi-Timeframe Analysis
Using the atr indicator across multiple timeframes offers a broader volatility perspective. A swing trader might consult the daily ATR to gauge overall market climate, then use the 1-hour ATR for fine-tuning entries or stops.
Aligning ATR readings avoids conflicting signals, for example, skipping intraday trades if the higher timeframe ATR is unusually low. This layered approach ensures all trade decisions reflect the prevailing volatility regime, enhancing consistency and confidence.
Advanced: ATR in Algorithmic and AI-Driven Systems
Modern algorithmic and adaptive strategies increasingly rely on the atr indicator as a core input. In automated trading, ATR values can trigger dynamic position sizing, adaptive stop placement, or volatility-based signal filtering.
Machine learning models often use the atr indicator as a feature, allowing systems to adjust parameters in real time. As markets become more automated in 2026, integrating the atr indicator into algorithmic workflows is key for robust, adaptive trading systems.
Adaptive ATR Integration: PipTrend’s Approach
PipTrend’s AI-driven platform interprets the atr indicator alongside other volatility measures for actionable trading signals. It delivers instant buy or sell recommendations, multi-timeframe analysis, and customized alerts, enabling traders to respond swiftly as ATR readings shift.
With built-in tools for stop-loss optimization, position sizing, and trend alignment, PipTrend leverages the atr indicator to eliminate guesswork. This empowers users to navigate both high and low volatility periods with greater confidence and precision.
Advanced ATR Applications and Common Pitfalls to Avoid
In modern trading, the atr indicator stands out for its adaptability across volatile markets. As you move beyond the basics, it becomes essential to understand how to leverage ATR in specialized systems, combine it with other tools, and avoid pitfalls that can undermine your strategy. This section explores advanced applications and real-world lessons to help you navigate volatility confidently.
ATR in Volatility Breakout and Trend-Following Systems
The atr indicator is a cornerstone of volatility breakout strategies. Traders often monitor for sudden spikes in ATR, which can signal that a market is transitioning from a quiet phase to a high-energy breakout. A sharp rise in ATR suggests increased participation and fresh momentum, making it easier to spot breakout opportunities.
In trend-following systems, ATR helps confirm the strength of a move. If price action aligns with a rising ATR, the trend may have more room to run. Conversely, a flat or falling ATR during a supposed trend could signal exhaustion. For deeper insights into how advanced models use ATR, see Exploring the predictability of range-based volatility estimators using RNNs.
Combining ATR with Other Indicators for Robust Strategies
While the atr indicator measures volatility, it excels when paired with complementary tools. Many traders combine ATR with momentum indicators like RSI or MACD for confirmation. For instance, an ATR spike alongside a bullish RSI crossover can strengthen a breakout signal.
Comparing ATR with other volatility-based tools, such as the Parabolic SAR, helps clarify each indicator’s role. If you want a direct comparison, check out Parabolic SAR and ATR comparison. Layering multiple indicators reduces false signals and helps you filter for higher-probability trades.
ATR in Risk Management and Portfolio Construction
The atr indicator is invaluable for risk management. By quantifying market volatility, ATR enables traders to size positions appropriately and set dynamic stop-loss levels. This ensures that every trade’s risk is proportional to the current market environment.
In portfolio construction, ATR readings can guide asset allocation. For example, traders might reduce exposure to assets with extremely high ATR values to control overall portfolio risk. This volatility-aware approach is especially important when managing multiple positions across forex, crypto, stocks, or indices.
Avoiding Common ATR Mistakes
Even experienced traders can misapply the atr indicator. One common mistake is overfitting ATR parameters to historical data, which can produce unreliable signals in live markets. Another error is ignoring the broader market context, such as major news or low-liquidity periods, when interpreting ATR spikes.
Additional pitfalls include:
- Applying ATR to illiquid or highly gapped assets
- Using ATR as a directional signal rather than a volatility gauge
- Failing to update ATR settings as market conditions evolve
Recognize these mistakes early to maintain a robust trading approach.
Adapting ATR Strategies for 2026 Market Trends
With algorithmic trading and 24/7 markets becoming the norm, the atr indicator must be adapted for new volatility regimes. Traders in 2026 need to revisit their ATR settings regularly, especially in crypto markets where volatility can shift overnight.
Stay agile by testing ATR periods and multipliers as conditions change. For example, during global news cycles or after major economic releases, a shorter ATR period might capture volatility spikes better. The key is to keep your strategies responsive to the evolving nature of modern markets.
Real-World Case Studies and Lessons Learned
Real-world use of the atr indicator reveals both success stories and cautionary tales. Some traders have navigated extreme volatility by relying on ATR-based dynamic stops, capturing profits during sharp moves while avoiding premature exits. Others have suffered losses from over-relying on ATR alone, missing broader macro signals.
Consider these lessons:
- A forex trader used ATR to adjust stops during a Brexit announcement, preserving capital amid chaos.
- A crypto portfolio manager diversified risk using ATR readings, smoothing out returns in a turbulent market.
- Conversely, traders ignoring news events sometimes misread ATR spikes, leading to avoidable losses.
By learning from these examples, you can refine your approach and master volatility in any asset class.
Optimizing Your Trading with ATR: Best Practices and Pro Tips
Optimizing your trading with the atr indicator requires a blend of technical skill, adaptability, and ongoing learning. In this section, you will discover proven best practices that help traders of all levels unlock the full potential of ATR. Whether you are day trading, swing trading, or investing long-term, these tips will boost your confidence in volatile markets.
Fine-Tuning ATR for Your Trading Style
The atr indicator is not a one-size-fits-all tool. To maximize its effectiveness, adjust the ATR period and multiplier to fit your strategy. Shorter periods, like 7 or 10, provide quicker responses for intraday traders, while longer periods, such as 14 or 21, help swing traders filter out market noise. Test different settings using both backtesting and forward testing to find the right balance between sensitivity and reliability.
Consider comparing ATR readings across various assets and timeframes. For a deeper understanding, explore this average true range indicator guide, which covers practical applications and nuances in period selection. Remember, optimal ATR settings can change as market conditions evolve, so review your setups regularly.
Building a Volatility-Responsive Trading Plan
A robust trading plan should include clear rules for using the atr indicator. Incorporate ATR values into your entry, exit, and risk management protocols. For example, you might decide to increase position size when ATR is low and reduce exposure during high volatility spikes. This approach helps you stay nimble and avoid overexposure in unpredictable markets.
Include ATR-based triggers for trade frequency and time-of-day filters in your plan. Create a checklist that prompts you to review ATR readings before each trade, ensuring you consistently account for changing volatility. By making your plan responsive to ATR, you transform volatility from a threat into an advantage.
Leveraging Trading Platforms and Tools for ATR Analysis
Modern trading platforms make working with the atr indicator simple and efficient. Most charting tools, such as TradingView and MT4, provide built-in ATR indicators with customizable settings. Take advantage of features like ATR-based alerts, automated stop-loss placement, and multi-timeframe overlays to streamline your workflow.
If you want to compare ATR with other volatility measures, check out trading indicators for volatility, which reviews different tools and their integration within popular platforms. Experiment with custom scripts or add-ons to further personalize your ATR analysis and ensure your trading system remains responsive to real-time market changes.
Continual Learning: Staying Ahead in Volatile Markets
Staying competitive with the atr indicator means never stopping your education. Monitor how ATR responds to different market regimes, including sudden news events or algorithmic trading surges. Join professional communities, attend webinars, and read the latest research to stay current on volatility trading best practices.
Keep a trading journal to log ATR settings, outcomes, and lessons learned from both successes and setbacks. This habit will help you refine your approach and quickly spot patterns that require adjustments. Embrace ongoing learning as your edge in adapting to market evolution.
Key Takeaways for Mastering Volatility with ATR
Mastering the atr indicator is a journey, not a destination. To recap, always tailor ATR settings to your trading style, integrate ATR into a flexible trading plan, and leverage advanced platform features for analysis. Commit to continuous learning and review your strategies as markets change.
Here is a quick checklist for effective ATR use:
- Adjust ATR period and multiplier for your strategy
- Build ATR into risk management and trade rules
- Use platform tools for alerts and automation
- Stay informed with up-to-date research and peer insights
- Review performance regularly and adapt as needed
By following these best practices, you will be well-equipped to turn volatility into a consistent trading advantage.
As you’ve seen throughout this guide, mastering volatility with the ATR indicator can truly transform the way you trade, whether you’re navigating forex, crypto, stocks, or indices. By understanding how ATR works and using it alongside powerful AI-driven tools like PipTrend, you’ll be able to respond to market shifts with greater clarity and confidence, no more second guessing your entries, exits, or risk management. If you’re ready to put these strategies into practice and start seeing measurable results in your trading, I encourage you to See Your Trading Improve With PipTrend.
Risk Disclaimer: Trading involves risk. Past performance doesn't guarantee future results. Only trade with money you can afford to lose. PipTrend is a tool to assist your trading decisions, not financial advice.