Bollinger Bands Guide: How to Use Them in 2025
On this page
Navigating the ever-changing landscape of 2025’s financial markets demands tools that adapt as quickly as prices move. That’s where bollinger bands come in, an essential, proven indicator designed to help traders make sense of volatility and seize new opportunities. In this guide, you’ll discover exactly how bollinger bands work, step-by-step instructions for setup, advanced strategies, and expert tips to maximize your results. Whether you’re new to technical analysis or looking to refine your edge, this comprehensive resource will empower you to trade confidently and stay ahead in dynamic markets.
What Are Bollinger Bands? Understanding the Basics
Bollinger Bands have become a staple in modern trading, helping investors navigate everything from stocks to crypto. Developed in the early 1980s, these bands are more than just lines on a chart, they’re a dynamic tool designed to measure price volatility and identify potential trading opportunities. If you’re new to technical analysis or want a deeper dive, Bollinger Bands: What They Are, and What They Tell Investors provides a solid foundation.
The Origin and Evolution of Bollinger Bands
John Bollinger created Bollinger Bands in 1983 to address the limitations of fixed-width trading channels. His goal was to develop an indicator that could adapt to changing market conditions, using real-time price volatility as its guide.
Over the decades, bollinger bands have gained widespread acceptance across diverse markets, stocks, forex, cryptocurrencies, and even indices. Major financial institutions, such as Fidelity and Charles Schwab, recognize them as a core tool for technical analysis.
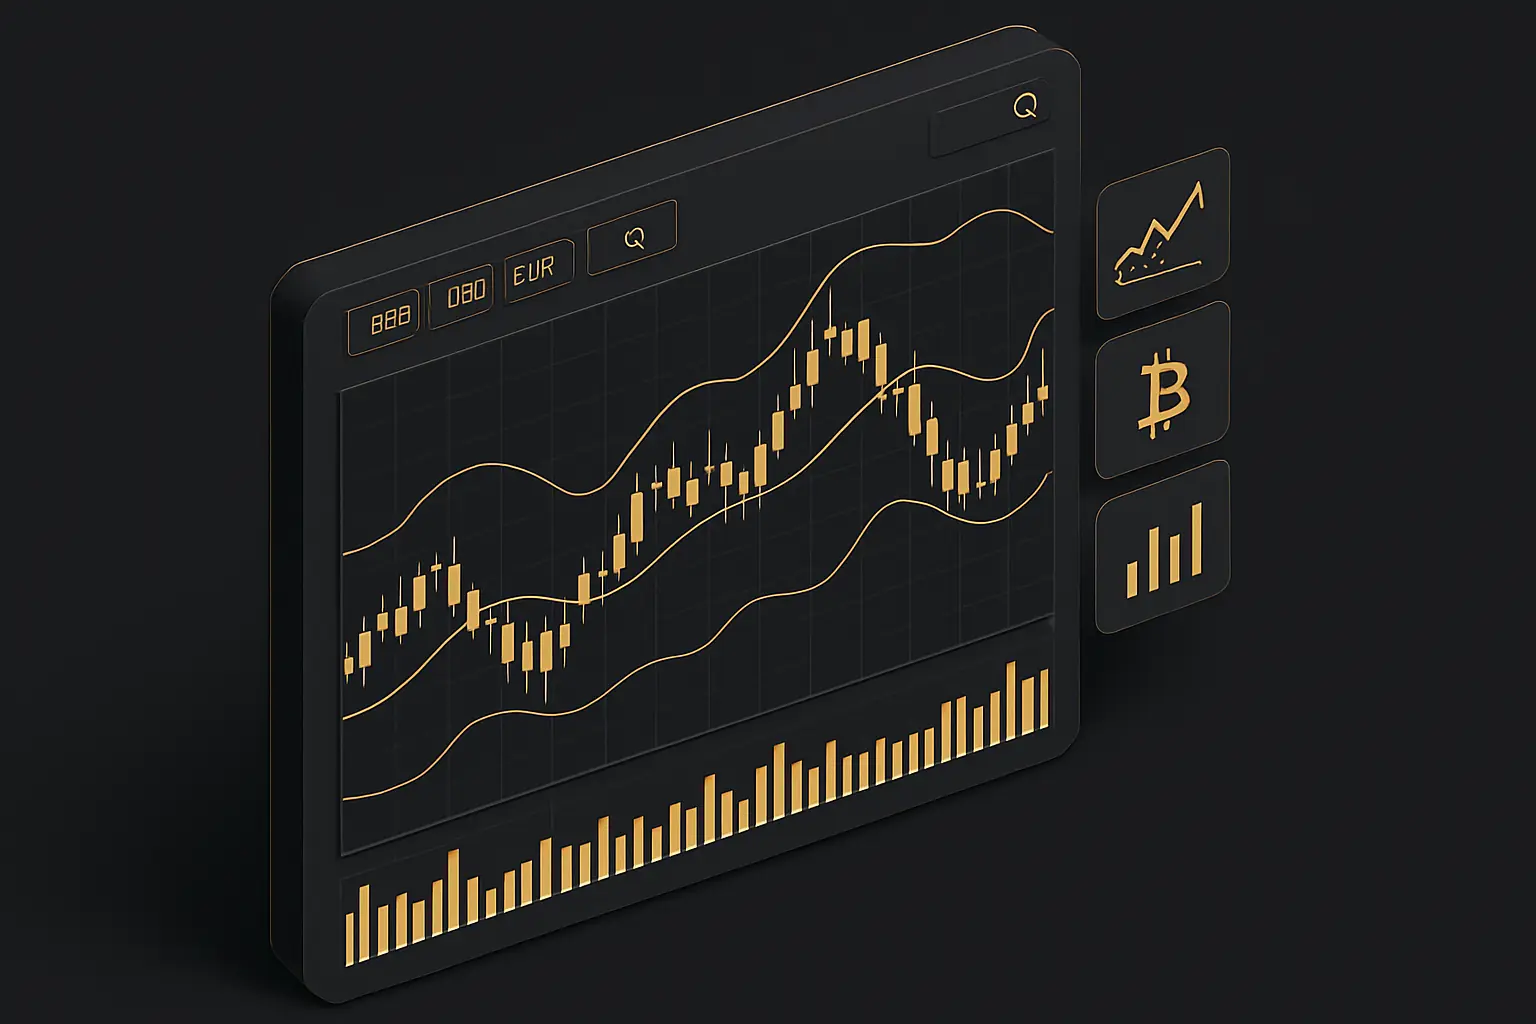
Key Components: Middle Band, Upper Band, Lower Band
Bollinger Bands consist of three primary components:
- Middle band: This is the simple moving average (SMA), usually set to 20 periods.
- Upper band: Plotted two standard deviations above the SMA.
- Lower band: Plotted two standard deviations below the SMA.
These bands automatically adjust their width based on market volatility, expanding during turbulent periods and contracting when markets are calm.
How Bollinger Bands Work
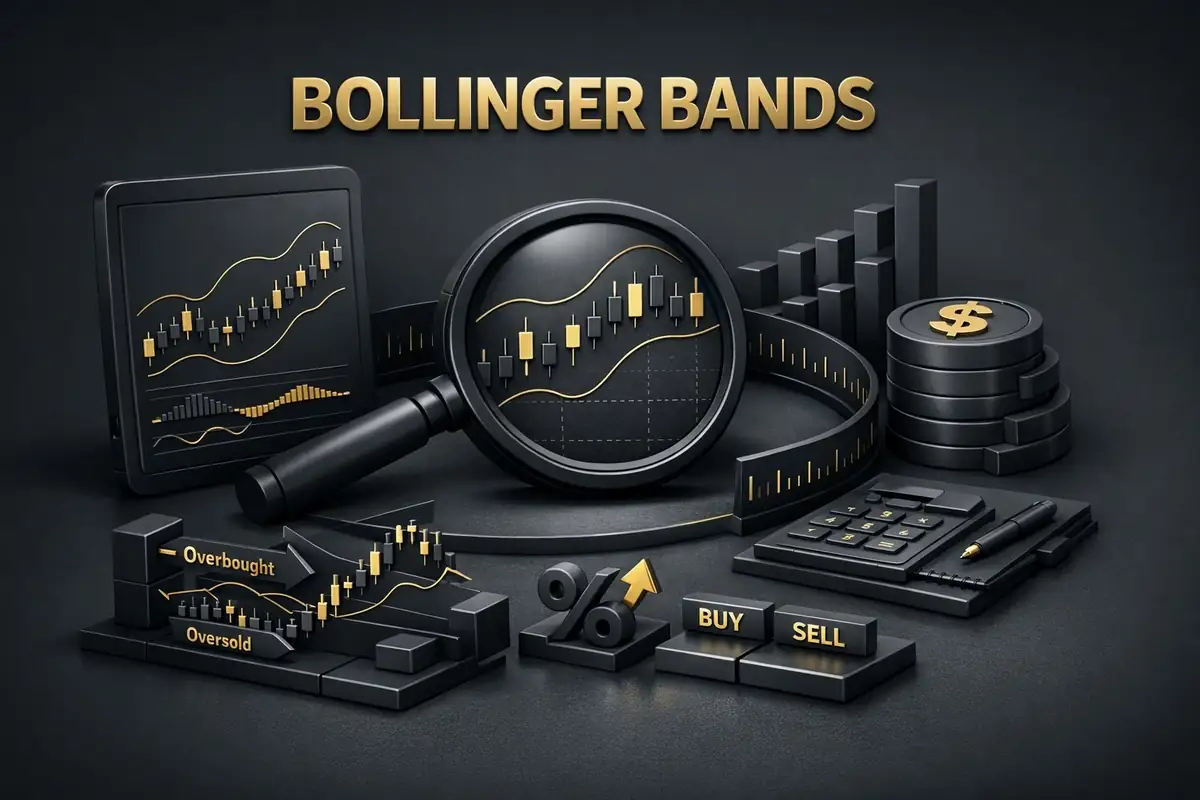
At their core, bollinger bands act as a visual envelope around price action. When markets become more volatile, the bands widen; during quiet periods, they squeeze closer together.
Traders use bollinger bands to spot overbought (price near upper band) and oversold (price near lower band) conditions. Bands also highlight trend strength and can signal when a reversal or breakout may be approaching.
Customization and Settings in 2025
While the classic 20-period SMA with a 2-standard deviation setting remains common, traders in 2025 often tweak these values to suit specific assets or strategies.
For fast-moving markets like crypto or forex, shorter periods and higher deviations can help capture sharper price swings. Modern trading platforms and adaptive tools now allow for more granular customization, making bollinger bands even more adaptable.
Advantages and Limitations
Here’s a quick breakdown of the strengths and weaknesses of bollinger bands:
| Advantages | Limitations |
|---|---|
| Flexible for multiple markets | Not a standalone signal |
| Intuitive visual cues | Band touches ≠ automatic buy/sell |
| Effective in trending/ranging | Needs confirmation with other indicators |
According to John Bollinger, band “tags” should never be used as automatic signals, they’re best combined with other tools for confirmation.
Real-World Example
Imagine the S&P 500 on a daily chart. During periods of high volatility, bollinger bands expand dramatically, capturing wild price swings. In contrast, during market consolidations, the bands contract, often foreshadowing a significant breakout.
Looking at historical data, several major market reversals and rallies were preceded by distinctive bollinger bands patterns, making them invaluable for traders seeking an edge.
How to Set Up and Read Bollinger Bands in 2025
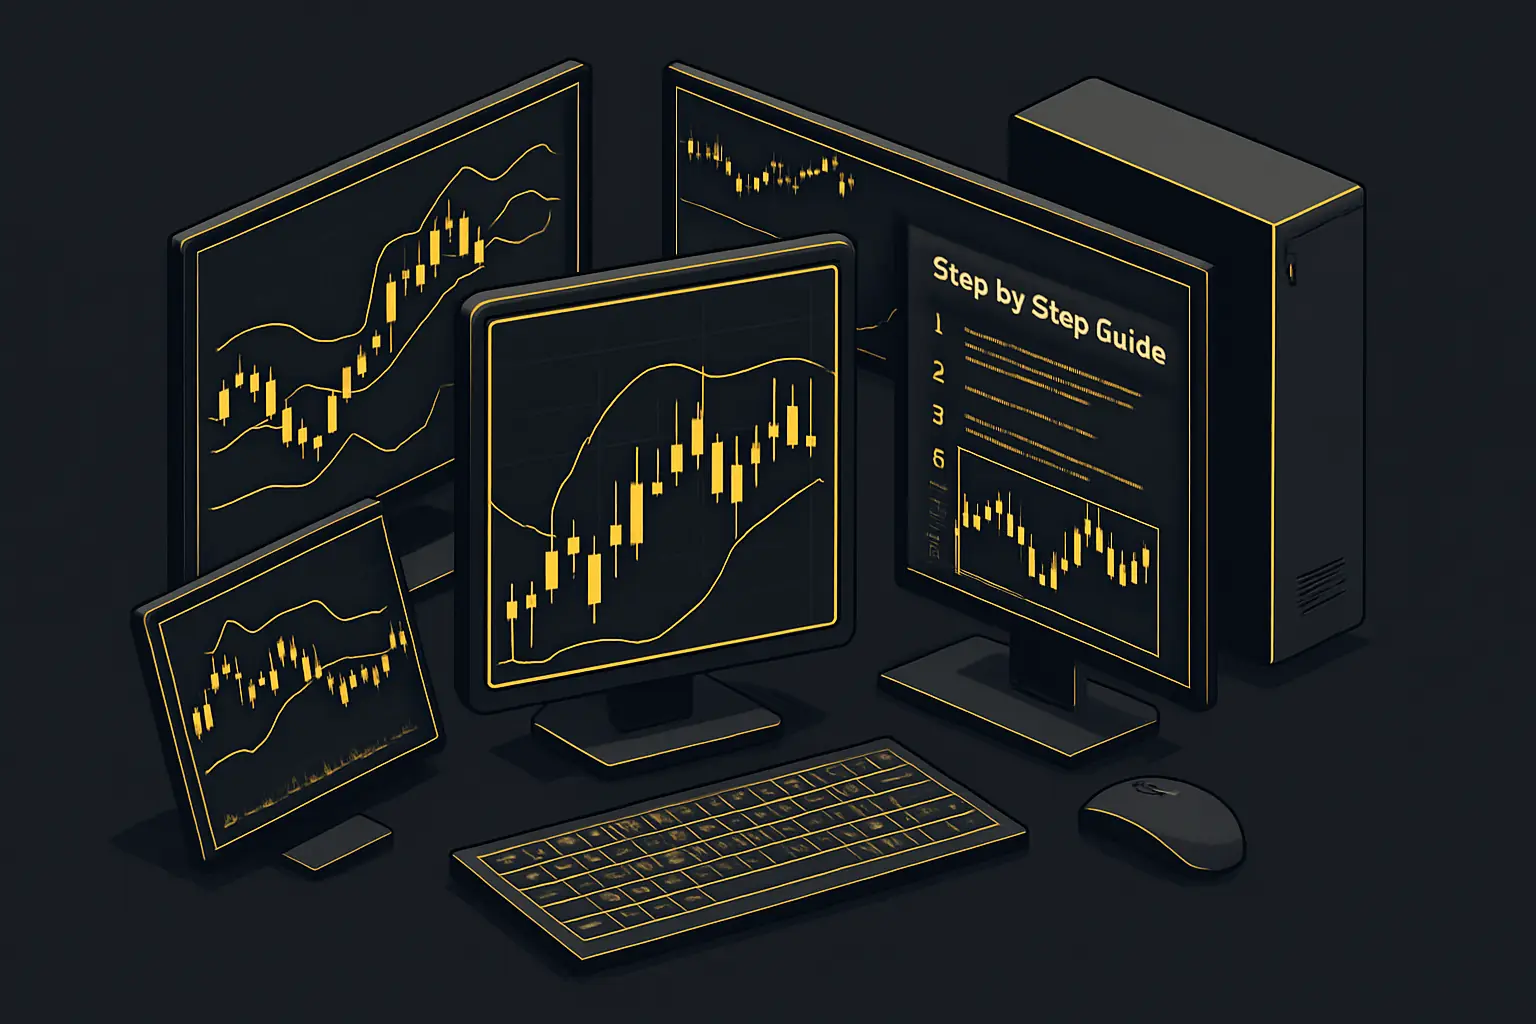
Mastering the setup and interpretation of bollinger bands is essential for traders in 2025. Whether you’re trading stocks, forex, crypto, or indices, following a structured approach ensures you get accurate signals and avoid common pitfalls.
Step 1: Selecting the Right Chart and Timeframe
Begin by choosing the appropriate asset class for your strategy, stocks, forex, crypto, or indices. The asset determines how responsive your bollinger bands will be to price changes.
Next, select your timeframe. Intraday traders often use 5-minute or 15-minute charts, while swing traders may prefer daily or weekly timeframes. Your trading style and goals should dictate this choice.
Remember, different assets and timeframes can yield varying signals. Testing multiple setups helps you find what aligns with your risk tolerance and trading approach.
Step 2: Applying Bollinger Bands to Your Chart
Most modern platforms, like TradingView, MetaTrader, and major broker interfaces, make it easy to add bollinger bands. Look for the “Indicators” menu, then search and select “Bollinger Bands.”
Set the parameters: the default is usually a 20-period simple moving average with bands at two standard deviations. Adjust colors and thickness for clarity. Advanced platforms let you fine-tune these settings for specific assets. For a comprehensive overview of trading indicators and how bollinger bands fit in, explore the Essential trader indicators guide.
Step 3: Interpreting Band Width and Price Position
Wide bands signal increased volatility, while narrow bands, often called a “squeeze”-indicate consolidation and potential breakout conditions.
- When price hugs the upper band, it may suggest overbought conditions.
- When price approaches the lower band, it might indicate oversold levels.
- If price “walks the band,” a strong trend could be underway.
Pay close attention to band width changes, as these often precede significant price movements.
Step 4: Recognizing Key Patterns and Signals
Certain chart patterns become clearer when using bollinger bands.
- A double bottom near the lower band is often a bullish reversal signal.
- An “M top” near the upper band may warn of a bearish reversal.
- The “three pushes to high” pattern can highlight momentum loss.
These setups help you anticipate potential turns, but always confirm with additional evidence.
Step 5: Common Mistakes to Avoid
Traders sometimes misinterpret band touches as automatic buy or sell signals. This is risky.
Other common mistakes include:
- Ignoring the overall trend or trading volume
- Over-relying on default settings without asset-specific adjustments
- Failing to confirm signals with other indicators
A quick reference table:
| Mistake | How to Avoid |
|---|---|
| Band touch as signal | Use confirmation indicators |
| Ignoring trend context | Analyze trend and volume |
| Not adjusting settings | Tune for asset/timeframe |
Practical Example
Let’s apply this step-by-step to a real chart. Open Apple (AAPL) on your chosen platform and add bollinger bands with default settings. Notice how, before a major volatility breakout, the bands contract tightly, a classic “squeeze.”
As price breaks out and the bands widen, the setup signals a potential trade opportunity. Practice this process on different assets to build confidence and refine your strategy.
Core Bollinger Band Strategies for Traders in 2025
Unlocking the full potential of bollinger bands in 2025 requires more than just knowing the basics. Successful traders rely on proven strategies, adapt to market shifts, and combine technical signals for smarter entries and exits. Let’s explore the most effective bollinger bands techniques for today’s dynamic markets.
Trend Trading with Bollinger Bands
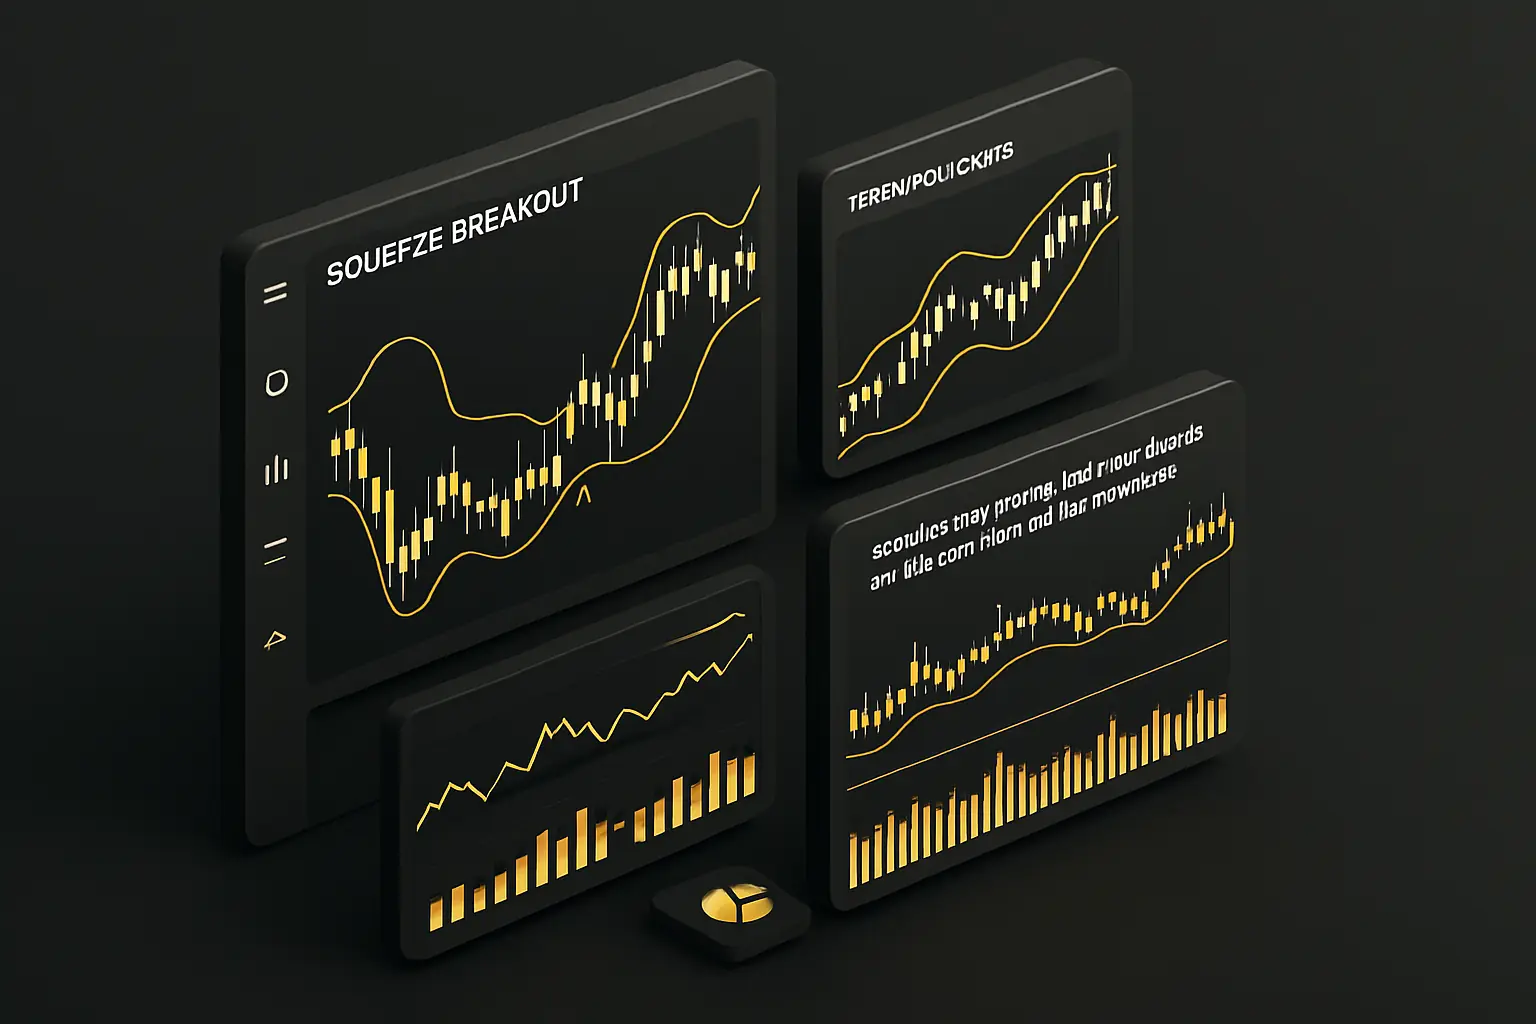
Bollinger bands excel at trend trading by highlighting when price action is strong and persistent. When the bands slope upward and price hugs the upper band, it’s a classic sign of bullish momentum. Conversely, a downward-sloping band with price “walking” the lower edge signals a robust downtrend.
To use bollinger bands for trend trading:
- Identify the band direction (up or down).
- Look for price consistently touching or closing near the trending band.
- Place stop-loss orders just outside the opposite band for dynamic risk control.
This approach lets you ride trends while using the bands as a visual guide for managing risk and spotting potential reversals.
The Bollinger Band Squeeze: Spotting Breakouts
One of the most powerful bollinger bands strategies is the squeeze. This occurs when the bands contract, reflecting a period of low volatility. A squeeze often precedes explosive price moves, think of it as a coiled spring ready to pop.
How to trade the squeeze:
- Watch for bands narrowing to their tightest point in weeks.
- Wait for a decisive close above the upper band (bullish breakout) or below the lower band (bearish breakout).
- Enter the trade in the direction of the breakout, using the opposite band as a stop-loss guide.
Band squeezes are especially potent during earnings season or before major news, when volatility can surge unexpectedly.
Mean Reversion and Reversal Patterns
Bollinger bands aren’t just for trend followers, they’re also invaluable for mean reversion and reversal trades. When price pierces the upper or lower band, it may signal exhaustion and an upcoming reversal.
Popular mean reversion setups include:
- Double bottoms forming near the lower band (bullish signal).
- M top patterns at the upper band (bearish signal).
- “Three pushes to high” indicating waning momentum.
Always confirm these patterns with volume spikes or candlestick reversals to avoid false signals. Remember, not every touch of the band means a reversal is imminent.
Combining with Volume and Momentum Indicators
Pairing bollinger bands with volume and momentum tools increases your edge. For example, combine band breakouts with a surge in trading volume or use the Relative Strength Index (RSI) to confirm overbought or oversold conditions. This multi-indicator approach filters out noise and boosts confidence in your trades.
If you want to deepen your understanding, check out Integrating RSI with trading strategies for practical tips on combining RSI and bollinger bands effectively.
Other useful pairings include MACD for trend confirmation and moving averages for additional support/resistance context.
Adapting Strategies for Different Markets in 2025
Different asset classes demand unique bollinger bands settings. For forex, consider tweaking the period and standard deviation to account for 24/5 market hours. In crypto, bands may need to be more sensitive due to constant price action, even on weekends.
Stocks and indices often react to scheduled news or earnings, so adjust your strategy for those volatility spikes. Test and optimize your parameters for each asset and timeframe to stay ahead in 2025’s ever-changing environment.
Risk Management and Position Sizing
Effective risk control is essential when trading with bollinger bands. Use the bands to set dynamic stop-loss and take-profit levels, placing stops just outside the bands can help protect against sudden reversals.
Consider this simple stop-loss formula:
Stop-Loss = Middle Band ± (Band Width × Risk Multiplier)Position sizing should reflect volatility, trade smaller sizes during wide bands (high volatility) and larger sizes when bands are tight (low volatility). Avoid overtrading during choppy, sideways periods when signals are less reliable.
Real-World Trade Example
Let’s bring it all together with a real-world example. In Q1 2025, the EUR/USD pair experienced a textbook bollinger bands squeeze on the daily chart. Bands contracted for several days, signaling a buildup of pressure.
When price broke above the upper band on a surge in volume, a strong uptrend followed. Traders who recognized the squeeze and combined it with confirming indicators captured a significant move, demonstrating the power of these strategies in action.
Advanced Bollinger Band Techniques and Customizations
Unlocking the full potential of bollinger bands in 2025 means going beyond the basics. Advanced techniques let traders adapt to changing market conditions, leverage automation, and craft strategies tailored to their unique needs. Let’s break down how to elevate your use of bollinger bands for modern markets.
Customizing Parameters for Modern Markets
Modern markets demand flexibility. The standard setting for bollinger bands is a 20-period Simple Moving Average (SMA) with bands set at 2 standard deviations. However, adapting these parameters can make a significant difference. For instance, shorter periods (like 10) increase sensitivity, great for fast-moving crypto, while longer periods (50 or 100) suit slower assets or higher timeframes.
- Adjust the deviation multiplier for more or less sensitivity: 1.5 for tighter bands, 2.5 for wider.
- Recommended settings: Crypto (10,2.5), Forex (20,2), Stocks (20,2) or (50,2) for weekly charts.
- Always test parameter changes on historical data before committing.
Customizing bollinger bands helps align your analysis with current market volatility and asset personality.
Multi-Timeframe Analysis
Analyzing bollinger bands across multiple timeframes provides deeper insight into trend alignment and potential reversals. For example, the daily chart might show a squeeze, while the 1-hour chart reveals a breakout already underway.
- Use higher timeframes for trend direction.
- Confirm entries on lower timeframes for precision.
- Aligning signals reduces false positives and increases confidence.
If you want to dive deeper, check out Multi-timeframe analysis techniques for actionable ideas on integrating bollinger bands across your trading workflow.
Integrating with Algorithmic and Adaptive Tools
Algorithmic trading and AI are transforming how traders use bollinger bands. Automated scripts can scan markets, generate alerts, and even execute trades when custom band conditions are met. AI tools can optimize parameters in real time, adapting to shifts in volatility or market regime.
- Use TradingView’s Pine Script or MetaTrader’s MQL for automation.
- Set alerts for band squeezes, breakouts, or “walking the band” trends.
- AI-driven systems can backtest thousands of parameter combinations efficiently.
For a deeper dive on automation and smart trading, explore Algorithmic trading and AI integration to see how cutting-edge tools can elevate your bollinger bands strategy.
Combining with Other Technical Indicators
Bollinger bands are powerful, but pairing them with other tools increases accuracy. Combine with moving averages for trend confirmation, or MACD for extra momentum insight. Fibonacci retracements help identify support and resistance within band boundaries.
- MACD crossovers + band squeeze = high-probability breakout.
- RSI overbought/oversold + band extremes = potential reversal.
- Volume spikes confirm the strength of a band-based signal.
Layering indicators helps filter out noise and boosts confidence in your trades.
Recognizing and Avoiding False Signals
Not every band touch signals a trade. Sometimes, prices “walk the band” during strong trends, leading to premature entries. Use volume spikes, momentum oscillators, or a higher timeframe confirmation to filter out weak setups.
- Look for a confluence of signals before acting.
- Avoid trading every band tag, context is key.
- Monitor “squeeze” conditions for genuine breakout potential.
This approach makes bollinger bands more reliable and minimizes whipsaws.
Backtesting and Optimization
Backtesting is crucial for validating your bollinger bands strategies. Use historical data to measure win rate, average return, and drawdown. Adjust periods and deviations to optimize for current market conditions, 2025’s volatility may call for tweaks not needed in past years.
| Metric | What to Track |
|---|---|
| Win Rate | % of profitable trades |
| Avg Return | Gain per trade |
| Max Drawdown | Largest loss period |
Run simulations before risking real capital, and always update your parameters as markets evolve.
Example: Custom Strategy Walkthrough
Let’s walk through a custom bollinger bands breakout strategy for Bitcoin. Set the bands to a 10-period SMA, 2.5 standard deviations. Wait for a squeeze, bands contract, volatility drops. When price closes above the upper band on rising volume, enter long. Place a stop just inside the middle band.
Backtesting this setup from 2023-2025 revealed a high win rate during trending periods and manageable drawdowns. Fine-tune your bollinger bands for each asset, and keep detailed records to refine your edge in 2025’s dynamic markets.
Integrating Bollinger Bands with Other Indicators and Trading Systems
Navigating today’s volatile markets requires more than just a single tool. That’s why traders often combine Bollinger Bands with other indicators and systems to improve signal reliability and adapt to changing conditions. By blending these approaches, you can filter out noise, confirm trends, and build higher-probability trading setups.
Why Combine Bollinger Bands with Other Tools?
Bollinger Bands are powerful for visualizing volatility and price extremes, but no indicator is flawless on its own. Pairing them with other technical analysis tools helps validate signals and reduce false positives. This multi-indicator approach is especially valuable in choppy or unpredictable conditions, where relying solely on Bollinger Bands might lead to overtrading or misinterpretation.
Combining indicators allows you to cross-check trade opportunities, ensuring that signals are supported by different market perspectives. It’s like having multiple weather forecasts before planning your journey.
Popular Pairings: RSI, MACD, Stochastic
Some of the most effective combinations involve momentum and trend indicators. For instance, when using Bollinger Bands with the Relative Strength Index (RSI), traders can confirm whether a price touching the upper or lower band truly reflects overbought or oversold conditions. The Moving Average Convergence Divergence (MACD) can signal trend direction, adding another layer of confirmation.
A recent Comparative Study on Predictive Performance of Bollinger Band Indicator: An Indian Market View found that blending Bollinger Bands with MACD and RSI over a decade provided nuanced insights into market cycles and improved strategy robustness. The Stochastic Oscillator also works well for timing entries and exits, especially when price nears band extremes.
Quick Comparison Table
| Indicator | What It Adds | Common Use with Bollinger Bands |
|---|---|---|
| RSI | Overbought/oversold momentum | Confirming band touches |
| MACD | Trend strength/direction | Filtering breakouts |
| Stochastic | Entry/exit timing | Spotting reversal opportunities |
Chart Pattern Recognition with Bands
Bollinger Bands excel in highlighting classic chart patterns. Double bottoms near the lower band often signal bullish reversals, while M tops near the upper band can indicate bearish turns. Recognizing these formations alongside band behavior sharpens your edge.
Patterns like the “three pushes to high” can warn of momentum exhaustion, especially if confirmed by other signals. By integrating pattern recognition with Bollinger Bands, you can spot subtle shifts before they become obvious to the wider market.
Volume Analysis and Volatility Indicators
Volume is the heartbeat of the market. When Bollinger Bands contract (a “squeeze”) and volume surges, it often precedes explosive breakouts. Pairing bands with volume indicators, or with the Average True Range (ATR), helps confirm whether a move is likely to continue or fade.
For example, a breakout above the upper band accompanied by high volume and a rising ATR can signal a strong, sustainable trend. Without this confirmation, band breaks may simply be false starts.
Algorithmic and Automated Trading Systems
Modern trading increasingly leverages automation. Traders now build bots and scripts to execute Bollinger Bands strategies with precision and speed. These systems can integrate multiple indicators, set alerts, and even adjust parameters based on live data.
A 2024 study on the impact of technical indicators in machine learning models highlights how Bollinger Bands, when combined with other tools, can enhance predictive accuracy and risk-adjusted performance in automated trading environments. Platforms like TradingView and MetaTrader offer robust scripting capabilities for these advanced setups.
Platform-Specific Integrations for 2025
Trading platforms have evolved, making it easier than ever to customize and automate Bollinger Bands strategies. Features like multi-indicator alerts, integrated backtesting, and adaptive recommendations are now standard. On platforms such as TradingView, you can create scripts that trigger trades only when several conditions, like a band breakout and RSI confirmation, are met.
MetaTrader users can deploy Expert Advisors to automate strategies that blend Bollinger Bands with momentum and volatility indicators. This flexibility allows traders to stay agile and responsive in fast-moving markets.
Example: Multi-Indicator Strategy in Action
Let’s walk through a practical example. Suppose you’re trading Tesla stock. You notice a Bollinger Bands squeeze on the daily chart. RSI is approaching overbought, and volume is building. As price breaks above the upper band, MACD crosses bullishly.
You enter a long position, place your stop just below the middle band, and monitor for a continued volume surge. This multi-indicator approach, using Bollinger Bands as the core, increases your chances of catching a sustained move while managing risk effectively.
Expert Tips, Best Practices, and Common Pitfalls
Unlocking the full potential of bollinger bands requires more than just adding them to your chart. To help you get the most out of this indicator in 2025, let’s explore expert techniques, common errors to dodge, and practical resources. Each tip below is designed to elevate your trading confidence and accuracy.
Pro Tips for Maximizing Bollinger Band Effectiveness
To truly harness bollinger bands, always analyze them in the context of the overall market trend. Adjust your band parameters to fit the asset’s volatility and your chosen timeframe. Don’t just rely on default settings, different markets in 2025 demand tailored approaches.
Keep a close eye on “squeeze” patterns. These are moments when the bands contract, signaling a potential breakout and creating high-probability opportunities. Looking for these setups can set you apart from less disciplined traders.
- Use confirmation tools like volume or RSI.
- Regularly backtest your approach.
- Stay flexible and adapt to changing market conditions.
Avoiding Common Mistakes
Many traders misuse bollinger bands by treating every band touch as a buy or sell signal. This approach ignores the bigger picture and can lead to unnecessary losses. Instead, focus on the trend direction and look for confirmation before entering trades.
Other frequent pitfalls include overfitting band parameters to past data, this reduces future reliability. Always pair your analysis with other indicators and avoid ignoring volume, which often holds the key to validating a signal.
- Don’t chase every move outside the bands.
- Avoid overtrading in sideways markets.
- Remember: not every squeeze results in a breakout.
Staying Updated: Bollinger Bands in 2025
The trading landscape is evolving rapidly, and so are the tools for analyzing bollinger bands. Modern platforms now offer advanced band customization, automated alerts, and AI-driven insights. Staying updated with these features will keep your strategies relevant and effective.
Continuous learning is crucial. Attend webinars, join trading communities, and follow updates from reputable sources. This way, you’ll always be one step ahead in adapting to market shifts and new technical developments.
Learning from Real-World Examples
Reviewing both successful and failed trades using bollinger bands can reveal valuable lessons. For example, analyzing trades from major market moves in 2024-2025 shows that band squeezes often precede significant volatility, but not every squeeze leads to a breakout.
Keep a trading journal to record your setups, outcomes, and the context for each trade. Over time, you’ll spot patterns in your results and refine your approach, leading to consistent improvement.
Resources for Further Mastery
For those eager to deepen their knowledge of bollinger bands, start with foundational books like “Bollinger on Bollinger Bands” by John Bollinger himself. There are also numerous online courses, interactive webinars, and thriving communities where you can discuss strategies and share insights.
- Recommended reading: “Bollinger on Bollinger Bands”
- Online resources: trading forums, YouTube tutorials
- Participate in live trading sessions for hands-on experience
Data-Driven Insights
Understanding how bollinger bands perform in real markets is essential. Recent statistics show that, while band-based strategies have historically enjoyed solid win rates, their effectiveness can fluctuate as more traders adopt them. For a deeper dive, the study Popularity versus Profitability: Evidence from Bollinger Bands explores how widespread use impacts profitability and why adapting your approach is key in 2025.
Reviewing win rates, drawdown statistics, and performance during high-volatility periods will help you set realistic expectations and refine your strategies accordingly.
Final Checklist for Traders
Before executing any trade with bollinger bands, run through this final checklist:
| Step | Action |
|---|---|
| 1 | Set up bands with asset-appropriate parameters |
| 2 | Confirm signals with additional indicators |
| 3 | Identify the overall trend and market context |
| 4 | Set dynamic stop-loss and take-profit levels |
| 5 | Log each trade and review performance regularly |
Ongoing journaling and post-trade analysis will ensure continual growth in your trading results. Mastering bollinger bands is a journey, commit to refining your edge every step of the way.
Now that you’ve got a solid grip on how Bollinger Bands work and the strategies you can use in 2025, why not take your trading to the next level? With all this knowledge, it’s time to put it into action, especially with tools that make the process smoother and more reliable. If you want real-time, adaptive signals and clear, actionable alerts across forex, crypto, stocks, and indices, you owe it to yourself to try a smarter approach. See Your Trading Improve With PipTrend and start trading with more confidence and clarity today.
Risk Disclaimer: Trading involves risk. Past performance doesn't guarantee future results. Only trade with money you can afford to lose. PipTrend is a tool to assist your trading decisions, not financial advice.