Supertrend Indicator Guide: Master Trend Analysis in 2026
On this page
Unlock the secret behind professional traders’ trend analysis with the supertrend indicator, one of 2026’s most reliable tools for mastering market direction.
This comprehensive guide demystifies the supertrend indicator, providing traders with actionable insights to elevate trend analysis and trading performance. Whether you are a beginner or an experienced trader, you will gain a step-by-step understanding of its core mechanics and advanced strategies.
Discover what the supertrend indicator is, how it works, optimal settings, practical applications, and integration with other tools. Stay ahead by learning current best practices for 2026. Ready to master trend analysis and improve your trading results? Start implementing these strategies today.
What is the Supertrend Indicator?
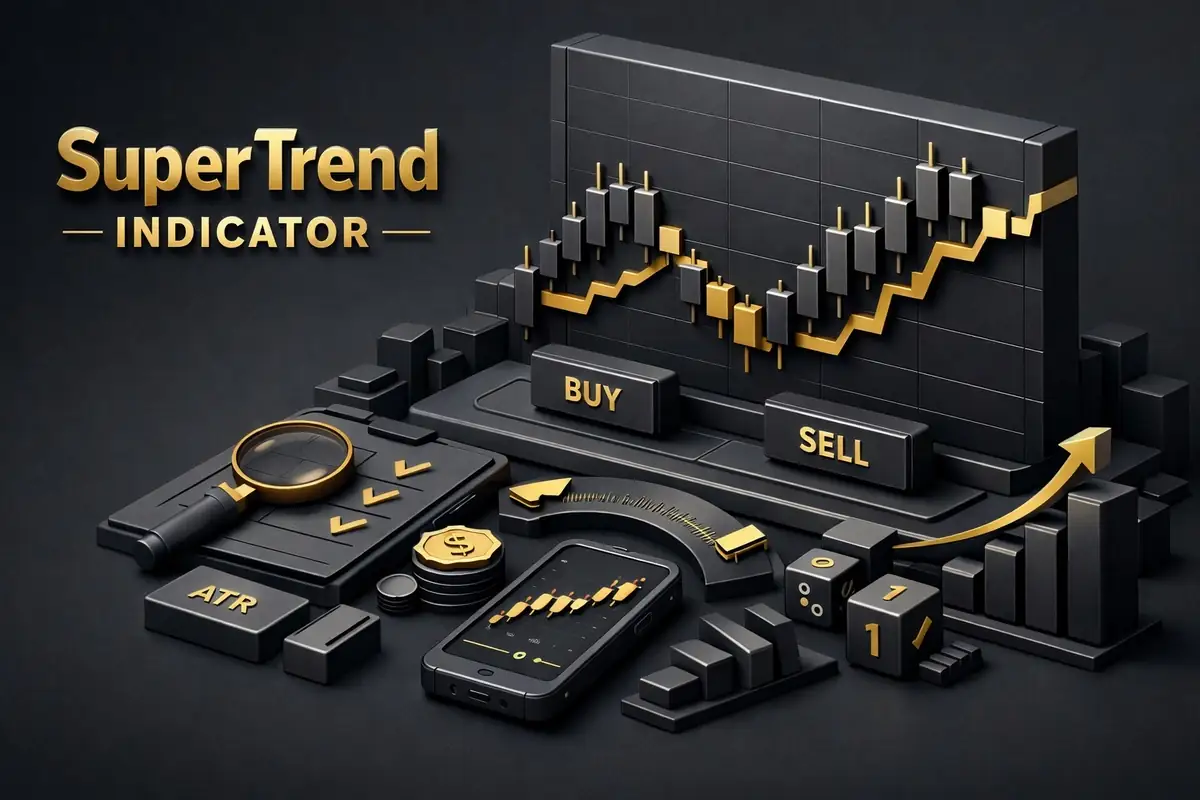
The supertrend indicator is a modern trend-following tool that has reshaped how traders identify market direction. Developed by Olivier Seban in 2009, it quickly gained traction among traders worldwide for its clarity and simplicity.
Origins and Development
Olivier Seban designed the supertrend indicator as an evolution of classic trend-following methods. Unlike older indicators, it integrates real-time volatility to adapt to changing markets. Since its introduction, it has become a core feature on platforms like MetaTrader and TradingView, making it accessible to a global audience.
Core Concept and Purpose
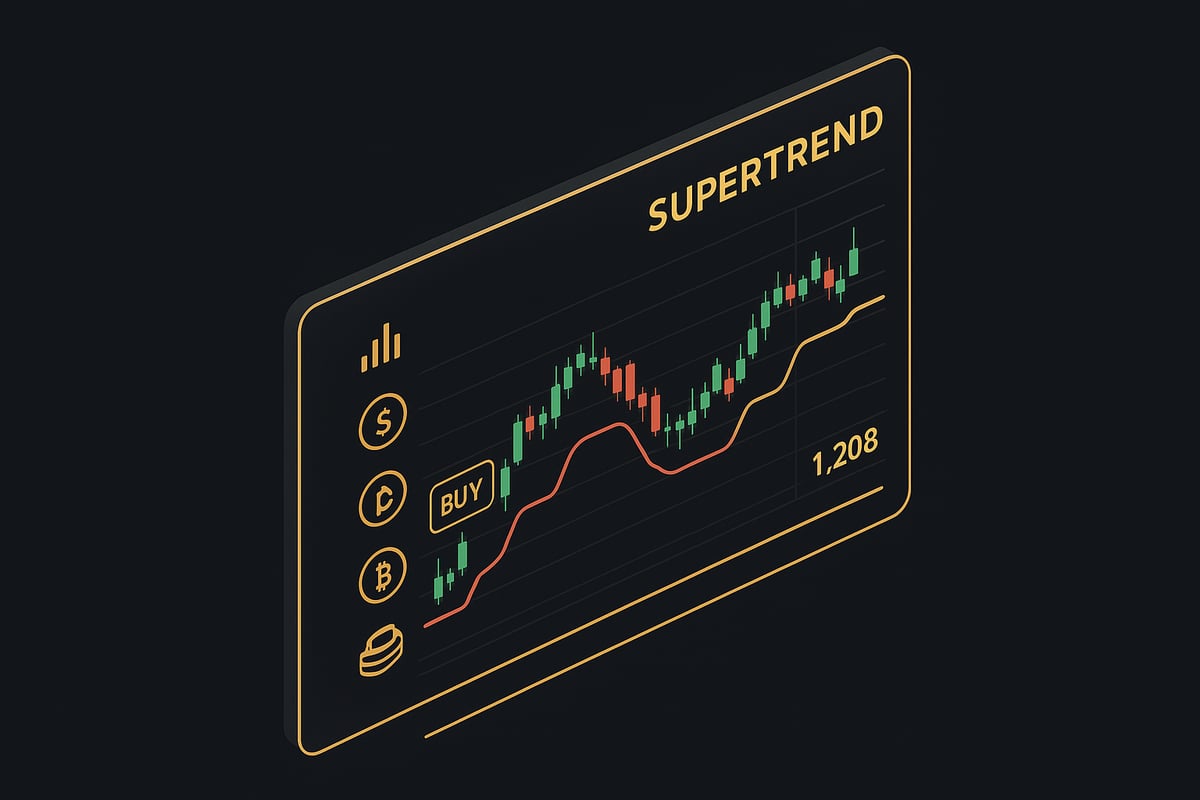
At its heart, the supertrend indicator uses the Average True Range (ATR) and a multiplier to create a dynamic line that tracks price movements. The indicator changes color based on trend direction: green signals an uptrend and a potential buy, while red indicates a downtrend and a potential sell. This visual approach helps traders quickly assess the current market bias.
How It Differs from Other Indicators
Unlike moving averages, which smooth price data over time, the supertrend indicator reacts to volatility and price extremes. While tools like MACD and RSI have their strengths, Supertrend’s use of ATR lets it adjust more responsively to rapid market changes. For a deeper understanding of how these tools compare, see the Moving average indicator basics.
| Indicator | Main Input | Signal Type | Adaptability |
|---|---|---|---|
| Supertrend | ATR, price | Color-coded trend | High |
| Moving Average | Price | Crossover, slope | Moderate |
| MACD | Price | Divergence, cross | Moderate |
| RSI | Price | Overbought/sold | Low |
Market Coverage and Versatility
The supertrend indicator is highly versatile, working seamlessly across stocks, forex pairs, cryptocurrencies, indices, and commodities. Traders use it for intraday scalping, swing trading, and even long-term trend following. For example, it can help spot reversals on a 5-minute forex chart or confirm trends on a weekly stock chart.
Popularity and Platform Integration
One reason the supertrend indicator is so popular is its integration into widely used trading platforms. Its user-friendly display and reliable signals have led to widespread adoption, from beginner traders to professionals. Whether you use TradingView or MetaTrader, Supertrend is likely available as a default option.
Key Benefits
The supertrend indicator offers several advantages. Its clear, actionable buy and sell signals reduce analysis paralysis, making it ideal for both new and experienced traders. The visual nature of its signals ensures you can quickly spot trend changes without complex calculations.
Limitations and Common Misconceptions
Despite its strengths, the supertrend indicator is not infallible. It works best in trending markets, but can produce false signals during sideways or low-volatility phases. It is not a standalone trading solution, and combining it with other tools often yields better results. Research shows Supertrend outperforms many indicators in strong trends, but may lag in ranging conditions.
How the Supertrend Indicator Works: Mechanics & Calculation
Understanding the mechanics behind the supertrend indicator is crucial for effective trend analysis. This section breaks down its calculation, chart representation, and practical application, equipping you to use it confidently across different markets.
Calculation Breakdown
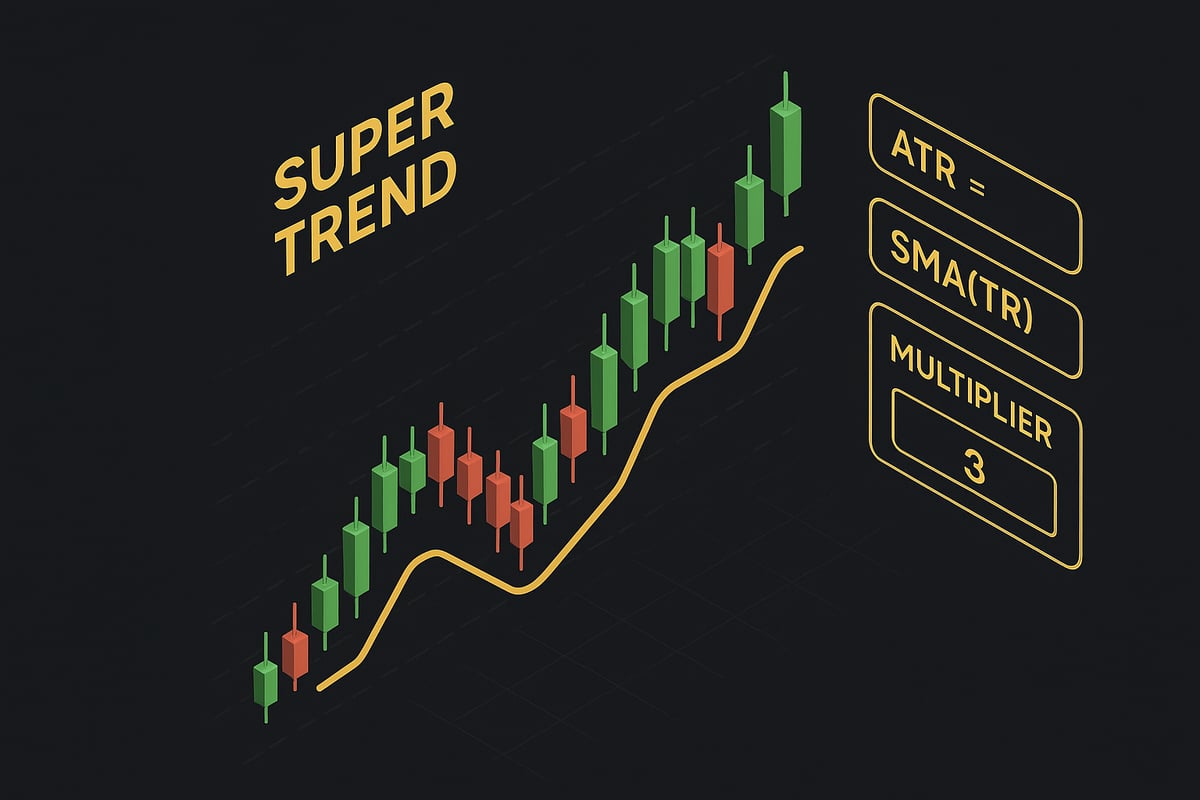
The supertrend indicator relies on a precise mathematical formula combining price action with volatility. At its core, it uses the Average True Range (ATR) to adapt to market conditions.
| Component | Formula |
|---|---|
| ATR | [(Prior ATR × (n, 1)) + Current TR] / n |
| Up Value | (High + Low) / 2 + Multiplier × ATR |
| Down Value | (High + Low) / 2, Multiplier × ATR |
The ATR typically uses a period of 10 or 14, reflecting recent price volatility. The multiplier adjusts how sensitive the supertrend indicator is to market movements. This approach ensures the indicator adapts to both trending and volatile phases.
Step-by-Step Signal Generation
Signal creation with the supertrend indicator follows a clear sequence:
- Calculate the ATR over the chosen period.
- Compute the Up and Down values using the formulas.
- Compare the current closing price to the previous supertrend value.
- Plot the line above or below price, adjusting color for trend direction.
For example, if price closes above the Down value, the supertrend indicator line shifts below the price and turns green, signaling an uptrend. This process repeats with each new bar, ensuring the indicator remains responsive to price changes.
Visual Representation on Charts
On trading platforms, the supertrend indicator overlays directly on the price chart. Green lines appear below price for uptrends, while red lines form above price in downtrends.
This visual clarity helps traders instantly spot trend direction. The supertrend indicator also acts as a dynamic support or resistance level, guiding both entries and exits. These features make it especially popular for both intraday and swing trading setups.
Default and Custom Settings
Most platforms set the supertrend indicator to a period of 10 and a multiplier of 3 by default. Adjusting these parameters can significantly impact signal frequency and reliability.
- Lower period/multiplier: More signals, but increased noise.
- Higher period/multiplier: Fewer signals, but stronger trends.
Settings like 7/2 or 14/4 are common alternatives for specific markets. Fine-tuning helps align the supertrend indicator with asset volatility and trading style.
Signal Interpretation
Interpreting the supertrend indicator is straightforward:
- Buy Signal: Price crosses above the indicator, line turns green.
- Sell Signal: Price falls below the indicator, line turns red.
- Stop-Loss: Place at or just beyond the current supertrend line.
This clear structure reduces ambiguity for both new and experienced traders. The supertrend indicator’s signals provide actionable guidance without extensive manual analysis.
Example Scenarios
Consider a daily chart of the QQQ ETF. When price closes above the red supertrend indicator line, it flips green, suggesting a potential long entry. Conversely, a close below the green line triggers a sell signal.
Intraday traders may use a 5-minute chart for faster signals, while swing traders rely on the daily or weekly timeframe. Real-world backtests, such as those found in Supertrend Indicator Trading Based on 4,052 Test Trades, demonstrate its effectiveness in capturing strong market trends with reduced false signals compared to traditional moving averages.
Limitations of the Calculation
Despite its advantages, the supertrend indicator does have limitations. It is inherently lagging, especially in rapidly moving markets where swift reversals can occur. Sideways or low-volatility conditions may produce false signals, leading to potential whipsaws.
Understanding these constraints helps traders avoid overreliance. Combining the supertrend indicator with other tools or filters can further enhance signal accuracy and overall trading success.
Best Supertrend Settings and Customization for 2026
Finding the right supertrend indicator settings is crucial for effective trend analysis in 2026. Optimal configuration depends on the asset, trading style, and current market conditions. With advanced tools and customization options, traders can now fine-tune the supertrend indicator for greater accuracy and reliability.
Default vs. Optimized Settings
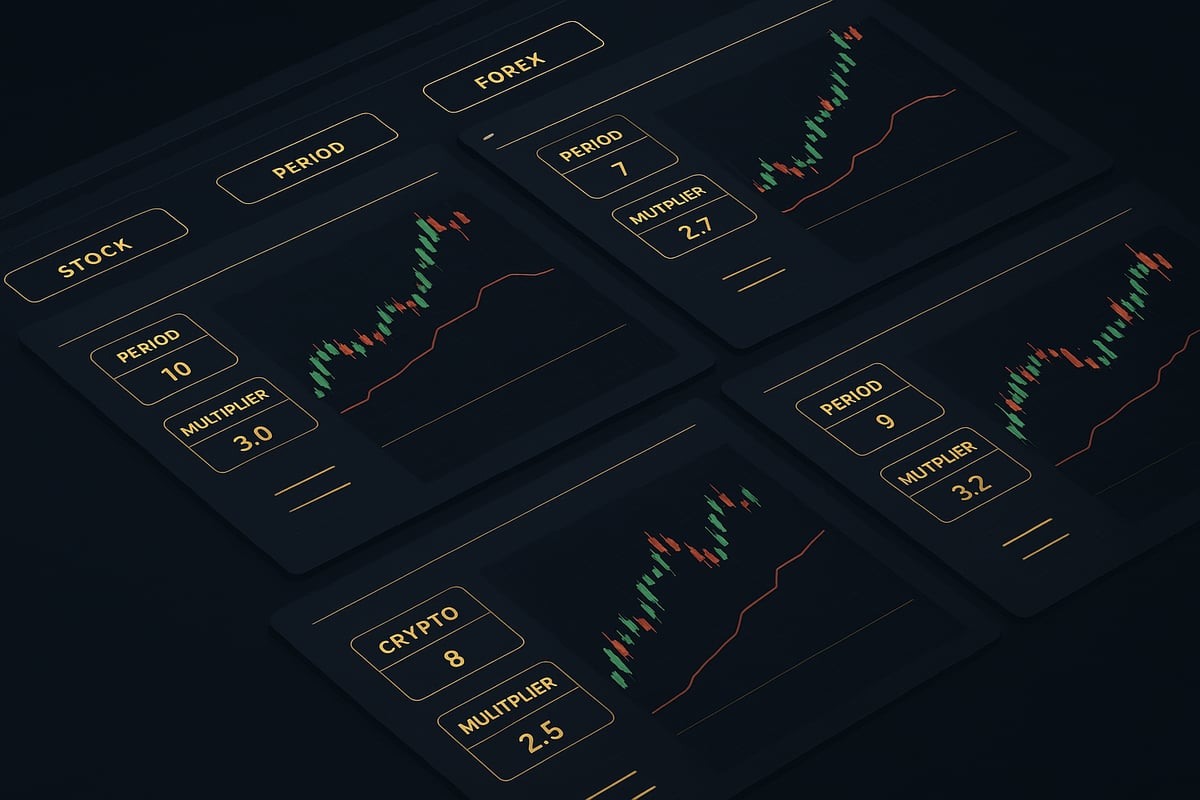
The supertrend indicator typically uses a default period of 10 and a multiplier of 3. These settings are widely effective for many assets and timeframes. However, optimizing these values can improve performance for specific strategies or markets.
| Setting Type | Period | Multiplier | Signal Frequency | Noise Level |
|---|---|---|---|---|
| Default | 10 | 3 | Moderate | Balanced |
| Lower | 7 | 2 | High | Higher |
| Higher | 14 | 4 | Low | Smoother |
Custom settings allow traders to balance between more signals and reduced noise. Lower periods and multipliers generate more signals, while higher values offer smoother trends.
Asset-Specific Adjustments
Different assets respond best to tailored supertrend indicator settings:
- Forex: Settings like 7 period and 2 multiplier enhance sensitivity for fast-moving pairs.
- Crypto: Bitcoin often works well with 10/3, while altcoins may need 14/3 for stability.
- Stocks: Blue chips favor 10/3 or 14/4; high-beta stocks benefit from 7/2 for capturing volatility.
- Commodities and indices: Adjust based on the asset’s average volatility.
Matching the supertrend indicator to the asset’s behavior leads to clearer signals and better risk management.
Timeframe Considerations
Timeframe selection plays a vital role in customizing the supertrend indicator. Intraday traders may opt for 5- or 15-minute charts with lower periods and multipliers, such as 7/2, to capture quick moves. Swing or position traders often use daily or weekly charts, applying settings like 14/4 for smoother, more reliable signals.
Adapting the supertrend indicator to your preferred timeframe helps align with your trading objectives, whether short-term or long-term.
Avoiding Over-Optimization
Over-optimizing supertrend indicator settings can result in curve fitting, where parameters perform well on historical data but fail in live markets. To prevent this, always forward-test your chosen parameters on real-time data before committing capital.
For traders interested in advanced tuning, research such as Bayesian Optimization of Supertrend Parameters explores data-driven approaches to enhance indicator performance across diverse markets. This ensures your supertrend indicator settings remain robust and adaptable.
Combining with Risk Management
Risk management is essential when using the supertrend indicator. Always pair signals with stop-losses placed just beyond the indicator line. Use the Average True Range (ATR) distance for dynamic position sizing, adjusting trade size based on market volatility.
This approach helps protect capital during unexpected market swings and reduces the impact of false signals, especially in volatile environments.
Practical Examples
Consider adjusting the supertrend indicator for the Nifty 50 index versus EUR/USD. For Nifty 50, a 10/3 setting might balance signal clarity and noise, while EUR/USD may respond better to a 7/2 configuration for higher sensitivity.
Backtest results show that settings tailored to the asset and timeframe can enhance trend capture and reduce whipsaws. Experimenting with parameters on demo accounts can help refine your approach without risking capital.
2026 Trends in Indicator Customization
Looking ahead, adaptive tools are transforming how traders optimize the supertrend indicator. Automated systems now analyze historical and real-time data to suggest ideal parameters. Multi-timeframe overlays are gaining popularity, allowing traders to see trend alignment across several chart intervals.
These innovations make the supertrend indicator even more versatile, supporting both beginners and professionals in adapting to evolving market conditions.
Practical Applications & Advanced Trading Strategies
Mastering the supertrend indicator means knowing how to apply it in real-world market scenarios. This section explores proven techniques and advanced strategies for maximizing your trading edge using the supertrend indicator across various asset classes and timeframes.
Entry and Exit Techniques
The supertrend indicator offers clear signals for both entering and exiting trades. For entries, a buy signal appears when the price closes above the green supertrend line. Conversely, a sell signal is triggered when the price closes below the red line.
To exit trades, many traders use the opposite signal. For example, if you entered long on a green signal, you might exit when the line turns red. Alternatively, you can set a trailing stop just below (for longs) or above (for shorts) the supertrend indicator line to lock in profits as the trend develops.
A simple approach is to use the supertrend indicator as a dynamic support or resistance level. If price tests the line and bounces, this can confirm your trade direction. For extra precision, combine these signals with volume spikes or chart patterns.
Intraday Trading Strategies
Intraday traders rely on the supertrend indicator for quick, actionable decisions. One effective technique is the breakout strategy. Here, you enter a trade as soon as the supertrend indicator flips color during a high-volume move, signaling a potential trend start.
Another method is the pullback strategy. Wait for price to retrace to the supertrend line after a signal, then enter in the direction of the trend if it holds. This can improve your risk-reward ratio.
For range breakouts, monitor for periods of consolidation. Once the price breaks out and the supertrend indicator confirms, take a position in the new trend direction. Reversal strategies focus on spotting exhaustion moves and entering as soon as the indicator changes color, signaling a possible trend change.
Swing and Long-Term Strategies
Swing and position traders use the supertrend indicator on higher timeframes, such as daily or weekly charts. The key is to hold positions as long as the indicator maintains its trend signal. For instance, if the line remains green, stay long and trail your stop below the line.
Breakout strategies are also effective for swing trades. Enter after a consolidation phase when the supertrend indicator flips, confirming a new trend. For even greater accuracy, combine with other confirmation tools or fundamental analysis.
A practical example: AAPL on the daily chart with the supertrend indicator and RSI for confirmation. Enter long when both confirm an uptrend, and exit when either signals a reversal.
Position Sizing and Risk Management
Effective risk management is crucial when trading with the supertrend indicator. A popular technique is to use the ATR distance (from the supertrend line to the entry price) for dynamic position sizing. The larger the ATR, the smaller your position should be to control risk.
Always place your stop-loss just beyond the supertrend indicator line. This helps minimize losses if the trend reverses. During volatile markets, this approach can significantly reduce loss size.
A helpful table for risk management:
| Entry Type | Stop-Loss Placement | Position Sizing Method |
|---|---|---|
| Long | Below green line | ATR-based calculation |
| Short | Above red line | ATR-based calculation |
By consistently applying these principles, you can enhance both your profitability and discipline.
Combining with Other Indicators
The supertrend indicator is even more powerful when paired with other tools. RSI is a popular choice for confirming momentum before entering a trade. For example, wait for both the supertrend indicator to turn green and RSI to move above 50 before buying.
MACD can help filter out false signals, especially in sideways markets. If both MACD and the supertrend indicator agree, confidence in the trend increases. EMA crossovers, such as 5/20, offer another layer of confirmation.
To dive deeper into how RSI can work alongside the supertrend indicator for more reliable signals, see this guide on the RSI indicator for confirmation.
Asset Class Applications
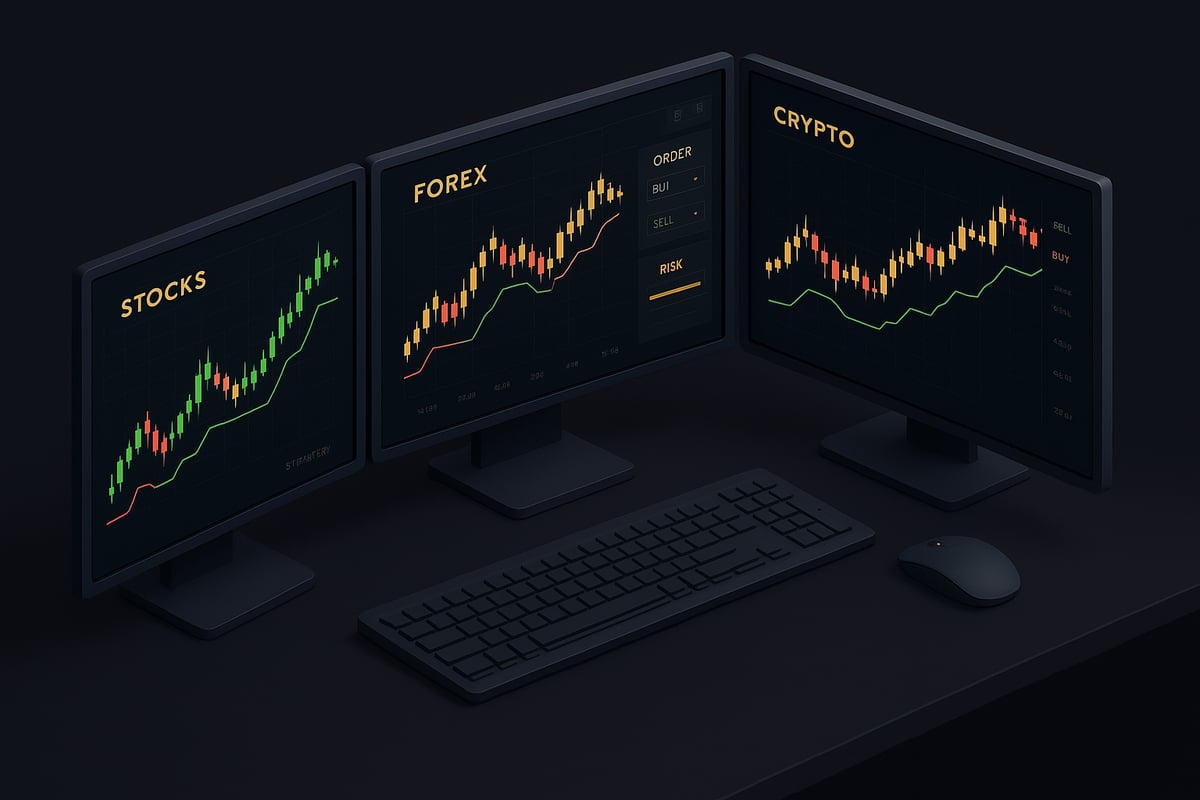
The supertrend indicator adapts well to different markets. In stocks, it works on large caps, mid caps, and even volatile penny stocks. Forex traders often use it for major pairs like EUR/USD and GBP/USD, adjusting settings for volatility.
In crypto, the supertrend indicator is favored for Bitcoin and Ethereum, where trends can be sharp. Commodities and indices, such as gold or the S&P 500, also benefit from its clear trend signals.
No matter the asset, always tailor your supertrend indicator settings to the specific market’s volatility and trading style.
Real-World Results and Case Studies
Backtesting shows the supertrend indicator outperforms basic moving averages in strong trending markets. For example, in trending phases, it generates fewer false signals and more reliable entries.
However, in sideways or low-volatility conditions, the supertrend indicator may produce whipsaws. Combining it with other filters, such as volume or momentum indicators, can help reduce these risks.
By understanding these strengths and limitations, traders can harness the full potential of the supertrend indicator in 2026.
Integrating Supertrend with Modern Trading Systems
Integrating the supertrend indicator with modern trading systems is essential for staying competitive in 2026. Today’s traders leverage advanced technology, automation, and multi-timeframe analysis to maximize the effectiveness of this versatile tool. Let’s explore how the supertrend indicator seamlessly fits into contemporary trading workflows.
Multi-Timeframe Analysis
Multi-timeframe analysis is a core feature for traders using the supertrend indicator. By comparing signals across intraday, daily, and weekly charts, traders can filter out noise and only act when trends align. For example, a buy setup is stronger when the supertrend indicator is green on both the hourly and daily chart. This approach minimizes false entries and increases confidence in trade direction.
Platforms like TradingView make this process intuitive, allowing overlays from different timeframes on a single workspace. For a detailed overview of platform options and integrations, review the best trading view indicators to see how supertrend fits with other top tools.
Algorithmic and Automated Trading
The supertrend indicator is popular among algorithmic traders for its rule-based clarity and ease of coding. Automated strategies can be built in environments like TradingView’s Pine Script or MetaTrader, where the indicator’s color flips trigger entries and exits. AI-driven bots are now optimizing parameters like period and multiplier in real time, adapting to shifting market volatility.
A notable example is the application of AI to the supertrend indicator, as outlined in the Algorithmic Trading Bot Using AI Supertrend Strategy. This research demonstrates how artificial intelligence can enhance trading accuracy by integrating machine learning with the indicator’s signals.
Portfolio Management and Asset Allocation
Asset managers are increasingly using the supertrend indicator to guide sector rotation and capital allocation. By scanning multiple assets for confirmed uptrends or downtrends, traders can shift exposure toward outperforming sectors. The supertrend indicator’s visual cues simplify the process of identifying which assets merit increased allocation.
Consider a table-based watchlist that highlights assets with active supertrend uptrends in green, making it easy to rebalance portfolios systematically. This approach is especially effective for diversified portfolios spanning stocks, forex, and commodities.
Integration with Risk Controls
Risk management is critical when using the supertrend indicator in a modern trading system. Advanced traders combine it with volatility filters, such as only trading when the ATR is above a certain threshold. This ensures that trades are taken when market momentum is sufficient.
Stop-loss placement is dynamically managed just beyond the supertrend line, adapting to market swings. Many systems use ATR-based trailing stops to lock in profits while riding trends, creating a robust safety net for automated or discretionary strategies.
Enhancing Signal Reliability
Signal reliability is boosted by confirming the supertrend indicator’s signals with other market data. Traders watch for volume spikes, candlestick reversal patterns, or news catalysts before entering positions. This multi-factor approach filters out low-probability setups and reduces the risk of whipsaws in choppy environments.
For those seeking to refine their strategy, exploring the best trading view indicators can provide ideas for combining the supertrend indicator with momentum or volatility tools for even stronger confirmation.
Limitations and Mitigation
Despite its strengths, the supertrend indicator is not infallible. It can generate false signals in sideways or low-volatility markets. To mitigate these issues, experienced traders employ additional filters, such as Bollinger Bands or momentum oscillators, to validate trends.
Recognizing market context is key. When the indicator gives conflicting signals across timeframes or assets, it is often best to wait for clarity. This disciplined approach ensures the supertrend indicator remains a reliable component of any modern trading system.
Pros, Cons, and Best Practices for Supertrend in 2026
Unlocking the potential of the supertrend indicator requires a clear understanding of its strengths, limitations, and optimal usage. Whether you are a new trader or a seasoned professional, this section presents a balanced view of how to maximize its impact in your trading toolkit.
Advantages
The supertrend indicator stands out for its simplicity and clear visual cues, making it accessible for all levels of traders. It works seamlessly across asset classes and timeframes, from stocks and forex to cryptocurrencies and commodities.
- Visual clarity: Instantly identifies trend direction with color-coded signals.
- Versatility: Suitable for intraday, swing, and long-term strategies.
- Lower false signals: In trending markets, it outperforms many classic indicators, as highlighted in studies like Supertrend Trading System on Bank Nifty Futures.
For those seeking actionable entries and exits, the supertrend indicator offers robust support.
Drawbacks and Limitations
Despite its advantages, the supertrend indicator is not without weaknesses. It tends to lag during rapid market reversals or extreme volatility, sometimes leading to delayed signals.
In sideways or low-volatility conditions, false signals can occur, potentially resulting in whipsaws. The effectiveness of the supertrend indicator is also highly dependent on selecting the right settings for each asset and timeframe.
Best Practices
To maximize the value of the supertrend indicator, always combine it with other tools for confirmation. Pairing with momentum indicators, such as RSI or MACD, can filter out noise and improve reliability.
- Test and adapt: Regularly adjust settings based on asset behavior.
- Risk management: Use stop-loss and dynamic position sizing.
- Context matters: Incorporate market news and price action insights.
For a broader perspective on integrating the supertrend indicator with other trading tools, see Technical indicators for trading.
Common Mistakes to Avoid
Over-optimizing the supertrend indicator for historical data can lead to curve fitting and poor real-time performance. Ignoring broader market context, such as economic news or sector trends, can also reduce its effectiveness.
Trading solely on supertrend indicator signals, without confirmation from other indicators, increases the risk of losses, especially in choppy markets.
Who Should Use Supertrend?
The supertrend indicator is ideal for beginners who value simplicity and clear signals, as well as advanced traders who seek customizability and integration with more complex systems.
It is best suited for those looking for an easy-to-interpret, actionable trend detection method that works across multiple markets and timeframes.
2026 Market Outlook
Looking ahead, the supertrend indicator remains popular among traders navigating increasingly algorithmic and AI-driven markets. Its integration with automation and AI tools, such as those offered by PipTrend, is set to enhance accuracy and efficiency.
As the trading landscape evolves, the supertrend indicator continues to be a reliable choice for mastering market trends and adapting to new technologies.
You’ve just explored how the Supertrend Indicator can bring clarity and confidence to your trading decisions in 2026, whether you’re analyzing forex, crypto, stocks, or indices. If you’re ready to move beyond theory and put these strategies into action, PipTrend’s adaptive platform is here to help. You’ll receive real time, reliable buy and sell signals that take the guesswork out of trading, so you can focus on making informed moves in any market. Let’s take the next step together and See Your Trading Improve With PipTrend.
Risk Disclaimer: Trading involves risk. Past performance doesn't guarantee future results. Only trade with money you can afford to lose. PipTrend is a tool to assist your trading decisions, not financial advice.