Momentum Indicator Guide: Master Market Trends in 2026
On this page
Are you ready to outsmart the markets and ride the strongest trends in 2026? The pace of change is accelerating, and those who can harness momentum have a clear edge over the rest.
In this guide, you will discover how the right momentum indicator can transform your approach, giving you the power to spot trends early and make smarter trading decisions. We will break down what these tools are, how they work, why they matter, and reveal expert-level strategies for real-world success.
Mastering momentum is more urgent than ever. Technical analysis and momentum signals are now essential for both retail and professional traders. This guide delivers actionable steps and proven strategies to help you achieve consistent gains. Dive in and unlock the knowledge you need to trade with confidence in the fast-moving markets of 2026.
Understanding Momentum Indicators: The Foundation of Trend Analysis
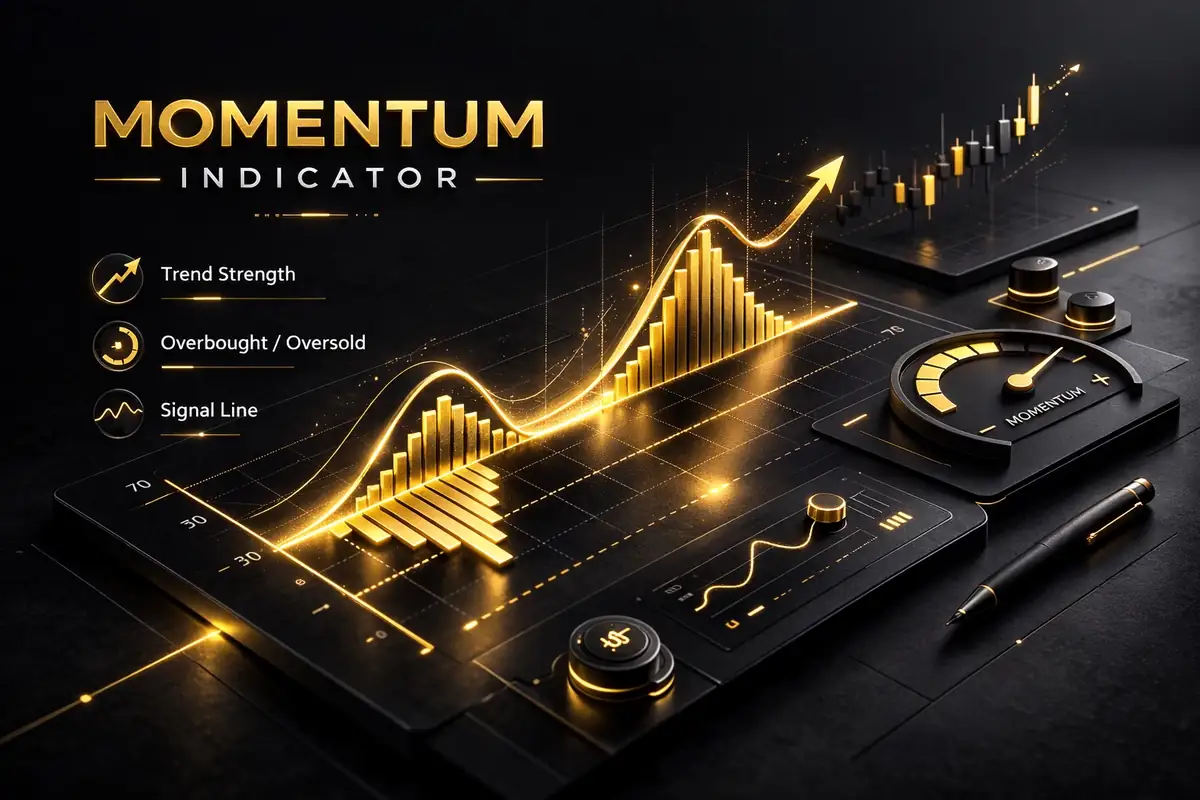
Momentum indicators are essential technical tools that measure the speed or strength of price movements in financial markets. Their primary purpose is to help traders identify overbought or oversold conditions, as well as assess the strength of a current trend. A momentum indicator is not directional, meaning it does not predict whether prices will rise or fall, but rather evaluates the rate of change. These indicators can be applied to a wide range of asset classes, including stocks, forex, cryptocurrencies, indices, and commodities. For example, the RSI assigns a value between 0 and 100 to reflect momentum. According to Investopedia, markets tend to rise for longer periods than they fall, making momentum analysis particularly valuable in bullish environments. It is important to note that a momentum indicator works best when used together with other technical tools for confirmation and context. For a deeper dive into one of the most popular momentum indicators, see the RSI indicator explained.
What Are Momentum Indicators?
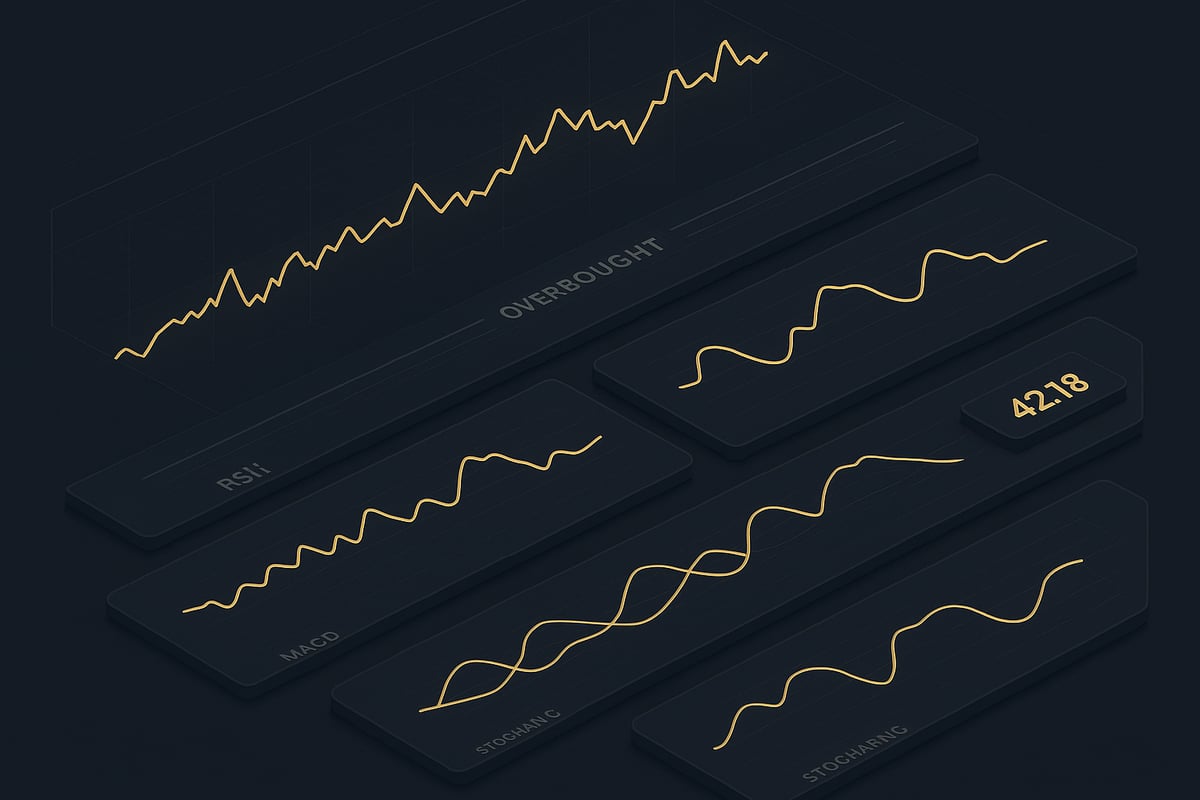
A momentum indicator is calculated based on price changes over a fixed period, such as 14 days for the RSI. These calculations use inputs like closing prices, averages, or ranges, and the resulting values are displayed as oscillators or line graphs below the main price chart. Most momentum indicators include clear threshold levels, such as 70 and 30 for RSI, to signal when an asset may be overbought or oversold. Divergence is a critical concept, occurring when the price and the momentum indicator move in opposite directions, often warning of potential reversals. For example, if the RSI rises while price continues to fall, this divergence might suggest a coming shift. However, it is crucial to interpret these signals within the broader context, as strong trends can produce false readings that persist for some time.
How Momentum Indicators Work
In 2026, the importance of the momentum indicator is growing due to the increasing volatility and complexity of financial markets. With the rise of AI-driven trading and global economic events, market conditions shift quickly and unpredictably. Both retail and institutional traders now rely more on momentum signals to navigate these rapid changes. Real-time analysis is essential, as news and data can impact prices almost instantly. Quantitative trading models that incorporate the momentum indicator are becoming standard practice. According to CFI, over 2.8 million professionals use technical analysis tools, highlighting their widespread adoption. Momentum indicators empower traders to stay ahead of sudden market shifts. This is especially evident in crypto markets, where momentum swings are frequent and significant, making timely analysis critical for performance.
Why Momentum Matters in 2026
Despite their value, every momentum indicator has limitations. In choppy or sideways markets, they can generate false signals, leading to poor trading decisions. Overreliance on a single indicator increases risk, as does ignoring the lagging nature of these tools, they often confirm trends after they have already begun. A momentum indicator measures the current strength of price movement, but it does not predict future direction. To improve accuracy, combine momentum indicators with trendlines or moving averages. For example, the RSI may remain overbought during a strong uptrend, so context is essential. The key insight is to use the momentum indicator as part of a holistic trading system, rather than in isolation.
The Most Effective Momentum Indicators Explained
Understanding which momentum indicator to use can significantly improve your ability to read market trends. Each tool has unique strengths, and knowing when and how to apply them is crucial for success in 2026.
Relative Strength Index (RSI)
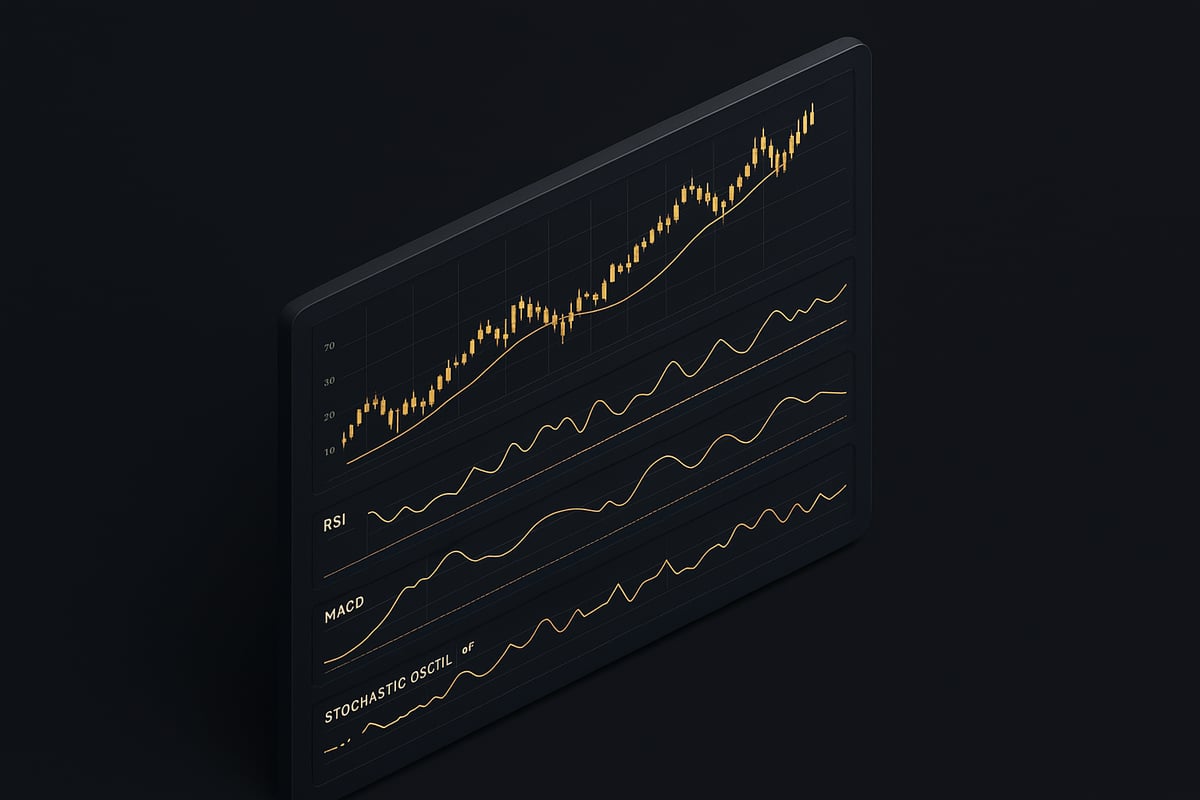
The Relative Strength Index (RSI) is a classic momentum indicator that measures the speed and magnitude of recent price changes. Displayed on a scale from 0 to 100, RSI helps traders spot overbought conditions above 70 and oversold conditions below 30. You can adjust these thresholds to 80/20 for more conservative signals, especially in volatile markets.
RSI is versatile, suitable for stocks, forex, crypto, and commodities. It works well on both daily and hourly charts, making it adaptable for different trading styles. For example, an RSI warning of a reversal before a trend turns can help traders lock in profits or avoid losses. Unlike comparative indicators, RSI focuses solely on the velocity of price movements rather than comparing assets. As one of the most-used technical tools, RSI remains the foundation of any momentum indicator strategy.
Moving Average Convergence Divergence (MACD)
The Moving Average Convergence Divergence (MACD) is a powerful momentum indicator that analyzes the relationship between two moving averages of price. It consists of the MACD line, signal line, and a histogram that visualizes the difference between the two. When the MACD line crosses above the signal line, it typically signals a bullish trend, while a cross below can indicate a bearish shift.
MACD is especially effective in trending markets, where it helps confirm entries and exits. For optimal results, traders often pair MACD with RSI to validate momentum shifts. For a deeper dive into how MACD works and how to use it in your trading, check out this comprehensive MACD indicator guide. While the MACD can lag during rapid market moves, it remains a critical component in any momentum indicator toolkit.
Stochastic Oscillator
The Stochastic Oscillator is a momentum indicator that compares a security’s closing price to its price range over a specific period, usually 14 days. It uses two lines, %K and %D, plotted on a scale from 0 to 100. Readings above 80 suggest overbought conditions, while those below 20 signal oversold levels.
Traders look for crossovers between the %K and %D lines to identify potential entry or exit points. The Stochastic Oscillator excels in range-bound markets, where it helps avoid false breakouts. For example, when the indicator diverges from price action, it often precedes a reversal. However, in highly volatile periods, this momentum indicator can generate frequent, less reliable signals.
Rate of Change (ROC) and Momentum
The Rate of Change (ROC) momentum indicator measures the percentage change in price over a set period, while the basic Momentum indicator tracks the absolute change in price. Both tools are valuable for spotting accelerations or decelerations in trends, making them essential for breakout or trend continuation strategies.
For instance, a sudden spike in ROC can signal an impending breakout, alerting traders to potential opportunities. These indicators are often used to confirm the validity of a price move or to identify when a trend is losing steam. ROC and Momentum are highly sensitive to sharp price movements, so it’s important to use them alongside other momentum indicator tools to minimize whipsaws and false positives.
Commodity Channel Index (CCI) and Others
The Commodity Channel Index (CCI) is a momentum indicator that measures how far a price deviates from its statistical mean. It is typically plotted within a range of +100 to, 100, with readings outside this band indicating overbought or oversold conditions. CCI is particularly effective for commodities and cyclical assets, helping traders identify potential reversals or the start of new trends.
Other noteworthy indicators in this category include Williams %R and the Awesome Oscillator, each providing unique perspectives on momentum. For example, CCI can signal a reversal in gold prices when it moves sharply outside its typical range. While these tools are powerful, they are best used in combination with trend-following indicators for greater reliability in momentum indicator analysis.
Combining Indicators for Robust Analysis
The real power of a momentum indicator comes from combining several tools to confirm signals and reduce false positives. For example, aligning RSI and MACD readings can boost trade confidence and improve win rates. When choosing which indicators to combine, make sure they analyze different market aspects to avoid redundancy.
Here is a quick comparison:
| Indicator | Best For | Typical Signal | Limitation |
|---|---|---|---|
| RSI | Trend reversals | Overbought/Oversold | Can remain extreme |
| MACD | Trend confirmation | Crossovers | Lags in fast markets |
| Stochastic | Range-bound trading | %K/%D crossovers | Frequent signals |
| ROC | Breakouts, momentum | Spikes | Sensitive to volatility |
| CCI | Cyclical assets | +100/-100 levels | Best with trend tools |
Confirmation using more than one momentum indicator increases the odds of success, helping traders filter out noise and focus on high-probability setups.
Step-by-Step Guide: Using Momentum Indicators to Master Market Trends in 2026
Mastering the use of the momentum indicator is a major advantage for traders in 2026. By following a systematic approach, you can transform raw market data into actionable insights. This step-by-step guide will help you set up your tools, interpret signals, and manage trades with confidence.
Step 1: Setting Up Your Charting Platform
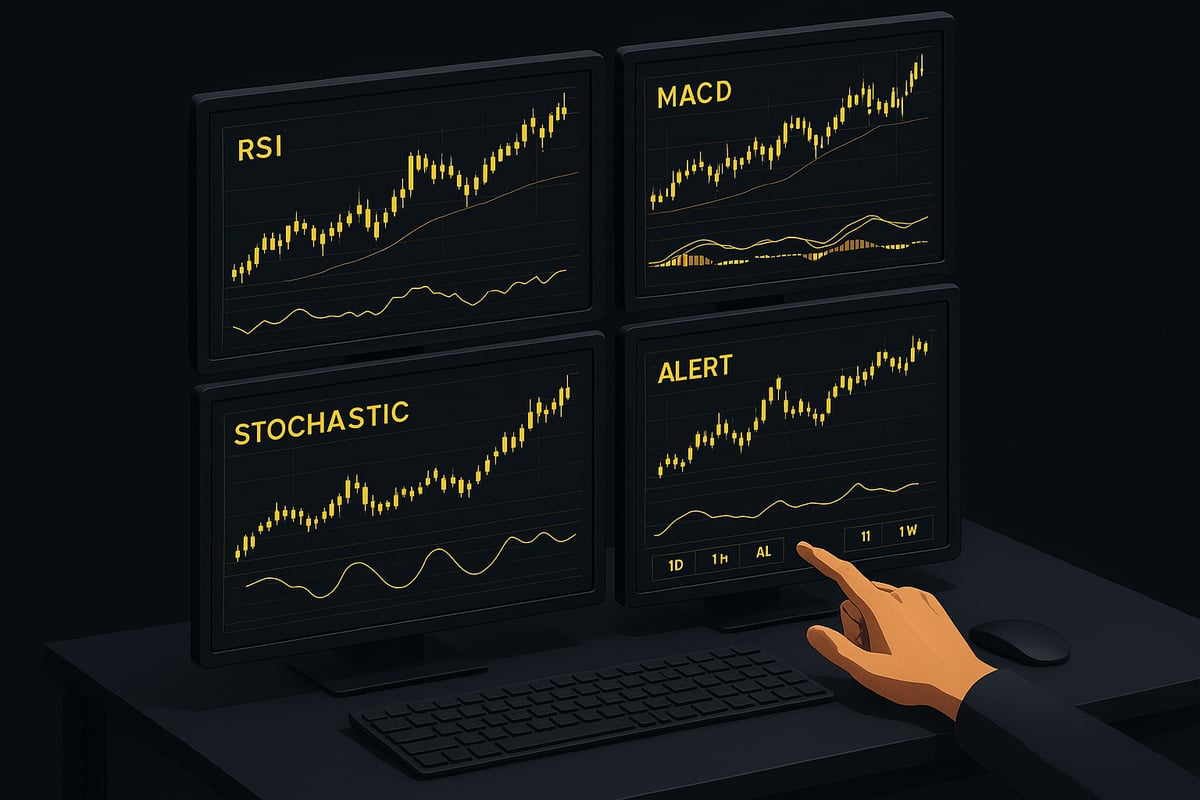
Choosing the right platform is the first step to leveraging the momentum indicator for market success. Leading platforms like TradingView and MetaTrader offer robust functionality for adding and customizing indicators. Start by searching for the momentum indicator, RSI, MACD, and Stochastic Oscillator in your platform’s tools menu.
To ensure you are using the best resources, consider referencing the best trading indicators guide. This will help you select effective tools for your strategy.
Customize indicator settings to fit your asset and timeframe. For example, set the RSI to 14 periods for daily charts. Save templates for different asset classes so you can switch quickly between forex, stocks, and crypto. Keeping your charts clean and uncluttered improves focus and reduces analysis paralysis.
Step 2: Identifying Market Conditions
Understanding the current market environment is essential before applying any momentum indicator. Begin by determining if the asset is trending or range-bound. Use moving averages or draw trendlines to provide context.
A 50-day moving average sloping upward often signals a strong uptrend. In contrast, a flat or choppy average can indicate a sideways market, where the momentum indicator may produce more false signals. Adjust the indicator’s sensitivity to match market volatility. Avoid relying solely on momentum indicators in non-trending conditions.
Step 3: Interpreting Indicator Signals
Reading signals from a momentum indicator requires attention to levels and context. Overbought levels (such as RSI above 70) or oversold levels (RSI below 30) often precede reversals. Look for divergence, where price and the momentum indicator move in opposite directions, as this can signal a potential trend change.
Confirm your findings with volume or another indicator for higher accuracy. For example, if price reaches new highs but the momentum indicator does not, this bearish divergence warrants caution. Use multiple timeframes to validate signals, and avoid making decisions based on a single candlestick or data point.
Step 4: Executing Trades Based on Momentum
Once your momentum indicator signals align with the trend, it is time to execute. Enter a trade when the indicator exits an overbought or oversold zone and the overall trend supports your position. For exits, watch for the opposite signals or when the momentum indicator shows the trend losing strength.
Set stop-loss orders just below recent lows or above highs to manage risk. For example, a MACD crossover combined with RSI exiting oversold can be a strong buy setup. Adjust your position size depending on the strength of the momentum indicator signal, and stay alert for rapid market reversals, especially in volatile environments.
Step 5: Managing Trades and Adapting to Market Changes
Effective trade management is critical when using a momentum indicator. As the trend develops, trail your stops to lock in gains. Gradually scale out of positions if momentum starts to wane or if the indicator signals a weakening trend.
If indicators begin to diverge from price action, reassess your trade. For example, tighten your stop-loss if the RSI approaches overbought while you are in an uptrend. Stay flexible and adapt your strategy as market volatility changes to protect your capital.
Step 6: Reviewing and Optimizing Your Strategy
Continuous improvement is key to mastering the momentum indicator. Keep a detailed trade journal to track which signals led to successful trades and which did not. Analyze your win and loss rates by indicator and market condition.
Adjust indicator settings based on historical data and your asset’s behavior. For instance, increasing the RSI period can help reduce noise in fast-moving crypto markets. Regularly backtest your approach, refine your strategy, and stay open to new insights to keep your edge sharp in 2026.
Advanced Strategies and Real-World Applications of Momentum Indicators
Unlocking the full power of a momentum indicator requires more than just knowing how it works. Advanced traders blend these tools with other techniques, adapt strategies to asset classes, and manage risk with discipline. This section explores how to elevate your trading by using momentum indicators in real-world scenarios.
Combining Momentum with Other Technical Tools
A momentum indicator becomes more powerful when paired with trend-following tools like moving averages or support and resistance levels. For example, an RSI oversold reading near a key support level can signal a high-probability trade. Incorporating price action patterns, such as bullish engulfing candles, adds another layer of confirmation.
Traders should avoid relying on too many similar indicators, as this can create redundancy rather than clarity. Instead, select indicators that measure different aspects of the market. Empirical research, such as the Trend and Momentum Indicators Study, highlights that combining momentum indicators with trend analysis can significantly improve trade accuracy across various markets.
The key is synergy: use each tool to validate signals from your momentum indicator, reducing false entries.
Understanding and Trading Divergences
Divergence is a powerful concept in momentum indicator analysis. It occurs when the price moves in one direction while the indicator moves in the opposite direction. There are two main types: bullish divergence, where price forms lower lows but the indicator forms higher lows, and bearish divergence, with price making higher highs as the indicator makes lower highs.
Spotting divergence can help traders anticipate reversals before the majority of the market reacts. However, it is crucial to confirm divergence signals with other evidence, as they can persist for several periods before a reversal materializes. For best results, monitor divergence on higher timeframes, where signals tend to be more reliable.
Mastering divergence trading with a momentum indicator can offer a decisive edge, especially during market turning points.
Multi-Timeframe Analysis for Higher Accuracy
Analyzing a momentum indicator across multiple timeframes can filter out noise and boost trade reliability. For instance, if the RSI signals oversold on both the daily and 4-hour charts, the probability of a successful trade increases. Multi-timeframe analysis helps traders avoid acting on isolated signals from short-term charts, which are often less reliable.
A practical approach is to use a higher timeframe for trend direction and a lower timeframe for fine-tuning entries and exits. This method gives a comprehensive view, aligning momentum with the broader market context.
Using a momentum indicator in this way reduces the risk of false signals and enhances overall strategy accuracy.
Adapting to Asset Classes: Stocks, Forex, Crypto, and More
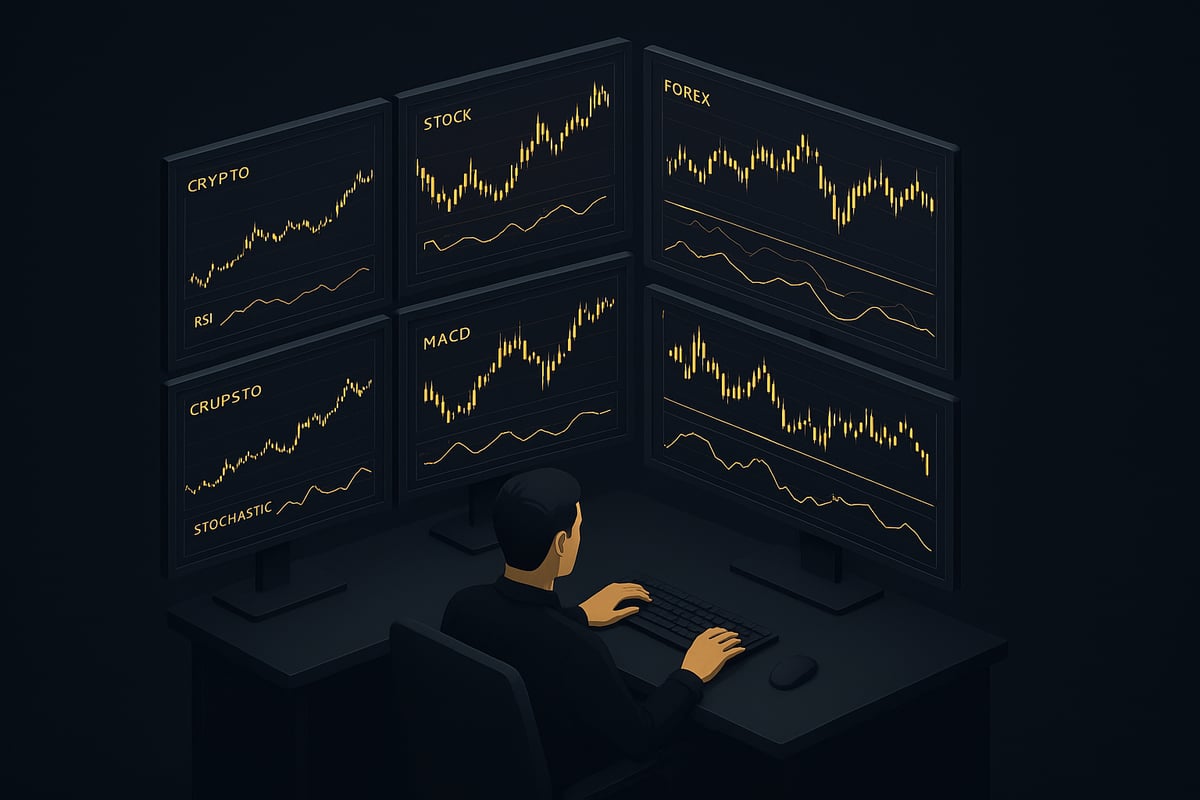
Momentum indicators are versatile, but each asset class has its nuances. In stocks, traders might combine momentum analysis with earnings releases or news events. Forex markets, known for high volatility, often require adjusting indicator settings to avoid excessive signals. For crypto, shorter cycles and frequent swings make real-time momentum tracking essential.
In commodities, tools like the Commodity Channel Index excel at identifying cyclical trends. Adapting your momentum indicator strategy to fit the unique behavior of each asset class can dramatically improve results.
Understanding these differences allows traders to extract the most value from every momentum indicator in their toolkit.
Risk Management and Psychology When Using Momentum Indicators
Effective use of a momentum indicator is not just about technical precision, but also about managing risk and emotions. Traders should set clear rules for entries, exits, and position sizing, avoiding the temptation to overtrade on every signal.
Maintaining discipline helps prevent losses from false signals, especially during periods of market turbulence. For example, limiting risk after a series of losing trades can protect capital and maintain confidence. Psychological resilience is as important as technical skill when relying on momentum indicators for decision-making.
Developing a robust mindset and risk framework ensures that the momentum indicator remains a tool for consistent, long-term success.
Future Trends: Momentum Indicators and AI in 2026
The landscape for the momentum indicator is evolving rapidly as technology, automation, and artificial intelligence reshape trading in 2026. Traders now demand tools that are faster, smarter, and more adaptive to shifting market conditions. Let us explore the most significant trends shaping the future of momentum analysis and how you can leverage these developments for a competitive edge.
The Evolution of Momentum Indicators
The momentum indicator has come a long way since its origins, evolving from classic tools like RSI and MACD to more advanced, customizable oscillators. Today, traders can fine-tune indicator periods, adjust thresholds, and automate calculations for greater precision.
Recent research has introduced innovative models, such as belief-based approaches that combine price history with behavioral data. For example, the Belief-Based Momentum Indicator Study demonstrates how blending past returns with belief information can enhance predictive power. As the market grows more complex, these new developments help traders adapt their momentum indicator strategies to stay ahead.
AI and Machine Learning in Momentum Analysis
Artificial intelligence is revolutionizing how traders use the momentum indicator. adaptive algorithms can process massive data sets in real time, adapting indicator parameters to current volatility and market structure. Machine learning models now identify subtle patterns and forecast trend strength with greater accuracy.
A recent study, AI-Enhanced Factor Analysis, highlights how machine learning frameworks can integrate technical and statistical factors for more robust trading signals. As these systems become more accessible, the momentum indicator is no longer just a static tool but an adaptive engine for smarter decision-making.
Real-Time Alerts and Multi-Timeframe Analysis
In 2026, the momentum indicator is integrated with instant alert systems and multi-timeframe dashboards, giving traders a holistic market view. Real-time notifications inform users when key momentum signals align across daily, 4H, or hourly charts, supporting both day and swing trading styles.
This approach reduces noise and increases signal reliability. By combining multi-timeframe momentum indicator readings, traders can filter out false breakouts and focus on high-probability opportunities. As a result, market participants can react swiftly to changing conditions and maintain a consistent edge.
Integration with Trading Platforms and Tools
Seamless integration is now essential for any momentum indicator. Modern platforms like TradingView and MetaTrader offer customizable scripts, allowing users to automate signal generation and trade execution. Traders can set up bots that respond to specific momentum readings, reducing manual intervention and emotional bias.
Plug-and-play solutions are in high demand, making it easier to implement the momentum indicator across asset classes. However, even with automation, user oversight remains vital for adapting to unexpected market behavior and maintaining risk controls.
PipTrend: Adaptive Momentum Trading Simplified
PipTrend is setting a new standard for the momentum indicator in 2026. This adaptive trading tool delivers real-time buy and sell signals across forex, crypto, stocks, and indices. With multi-timeframe analysis, PipTrend helps traders identify momentum shifts and trend direction with clarity.
The intuitive interface and step-by-step onboarding make the momentum indicator accessible to both beginners and experienced traders. Compatible with TradingView, PipTrend includes 24/7 support and lifetime updates, empowering users to master momentum strategies and thrive in fast-paced markets.
Case Studies: Momentum Indicators in Action
Explore how the momentum indicator shapes real trading decisions across different markets. These case studies illustrate practical setups, entries, and exits, helping you see how to apply the momentum indicator effectively in 2026.
Bull Market Example: Riding the Trend
In a strong bull market, such as the S&P 500 during a sustained uptrend, the momentum indicator offers traders a reliable edge. When the RSI pulls back from overbought levels, it signals a potential entry point. Combining this with a MACD confirmation allows traders to ride the trend confidently.
For example, when the momentum indicator aligns with a bullish MACD crossover, traders can enter positions early in the rally. Exiting when the MACD line crosses below the signal line helps lock in profits. According to Investopedia, bull markets historically persist longer, making the momentum indicator especially effective for capturing extended gains.
Bear Market Example: Spotting Early Reversals
Bear markets, such as a crypto downturn, present unique challenges. Here, the momentum indicator becomes crucial for identifying possible bottoms before the trend reverses. When price continues to decline but the momentum indicator, like RSI, starts to rise, a bullish divergence emerges.
Traders watch for the momentum indicator to exit oversold territory, then confirm the signal with a spike in trading volume. This early entry can deliver significant rewards if the market rebounds, though false signals are possible in persistent downtrends. Using the momentum indicator with volume helps filter out noise and improves timing.
Range-Bound Market Example: Avoiding False Breakouts
In sideways markets, such as a forex pair consolidating in a range, the momentum indicator helps traders avoid chasing false breakouts. The Stochastic oscillator, a popular momentum indicator, excels at identifying overbought and oversold conditions within well-defined price bands.
When the momentum indicator signals oversold at range support, traders enter buy positions, exiting at resistance when overbought levels appear. For an in-depth explanation, see this Stochastic oscillator overview. Since over 60% of market activity is range-bound, mastering the momentum indicator in these conditions is vital for steady profits.
Divergence Example: Trading Against the Crowd
Divergence occurs when price action and the momentum indicator move in opposite directions, often signaling a potential reversal. Imagine a stock making new lows, but the momentum indicator forms higher lows. This bullish divergence suggests the downtrend is weakening.
Traders using the momentum indicator wait for confirmation, such as a reversal candlestick or a break above resistance, before entering. Acting on divergence allows for contrarian trades that can capture reversals ahead of the crowd. Patience and discipline are required, as divergences may persist before price responds.
Multi-Timeframe Example: Increasing Trade Reliability
Aligning the momentum indicator across multiple timeframes boosts trade reliability. For instance, when gold shows mixed signals, traders analyze both daily and 4H RSI readings. Waiting for the momentum indicator to signal oversold on both charts increases confidence in the trade.
This multi-timeframe approach, supported by industry data, reduces false signals and improves win rates. In 2026, adapting the momentum indicator strategy to multiple timeframes is essential for staying ahead in volatile markets. Consistency across timeframes helps filter noise and provides a clearer trading roadmap.
Now that you’ve explored the essential strategies and practical steps to master momentum indicators for 2026, it’s time to put your knowledge into action. PipTrend’s adaptive platform gives you real-time, clear buy and sell signals across all major markets, so you can trade confidently, without second-guessing. You get instant alerts, multi-timeframe analysis, and a simple, intuitive interface that works for both beginners and experienced traders. If you’re ready to elevate your trading and catch the strongest trends before the crowd, Start Catching Winning Trades, Right Now!
Risk Disclaimer: Trading involves risk. Past performance doesn't guarantee future results. Only trade with money you can afford to lose. PipTrend is a tool to assist your trading decisions, not financial advice.