MFI Indicator Guide: Mastering Money Flow Analysis in 2026
On this page
As financial markets evolve and complexity grows in 2026, mastering advanced technical analysis tools is no longer optional, but essential for every serious trader. The mfi indicator stands out as a powerful resource, offering unique volume-based insights that can provide a decisive trading edge.
This comprehensive guide will walk you through everything you need to know about the mfi indicator. You will discover how it works, how to interpret its signals, and how to integrate it into your trading strategy for optimal results.
Dive in to explore expert tips, proven strategies, and actionable steps that will help you leverage the mfi indicator for more profitable decisions. Get ready to unlock the full potential of money flow analysis in the year ahead.
Understanding the Money Flow Index (MFI)
The Money Flow Index (MFI) indicator is essential for traders aiming to decode market trends using both price and volume. As markets evolve, understanding how to use the MFI indicator can give you a significant edge, especially when traditional momentum tools fall short.
What is the Money Flow Index?
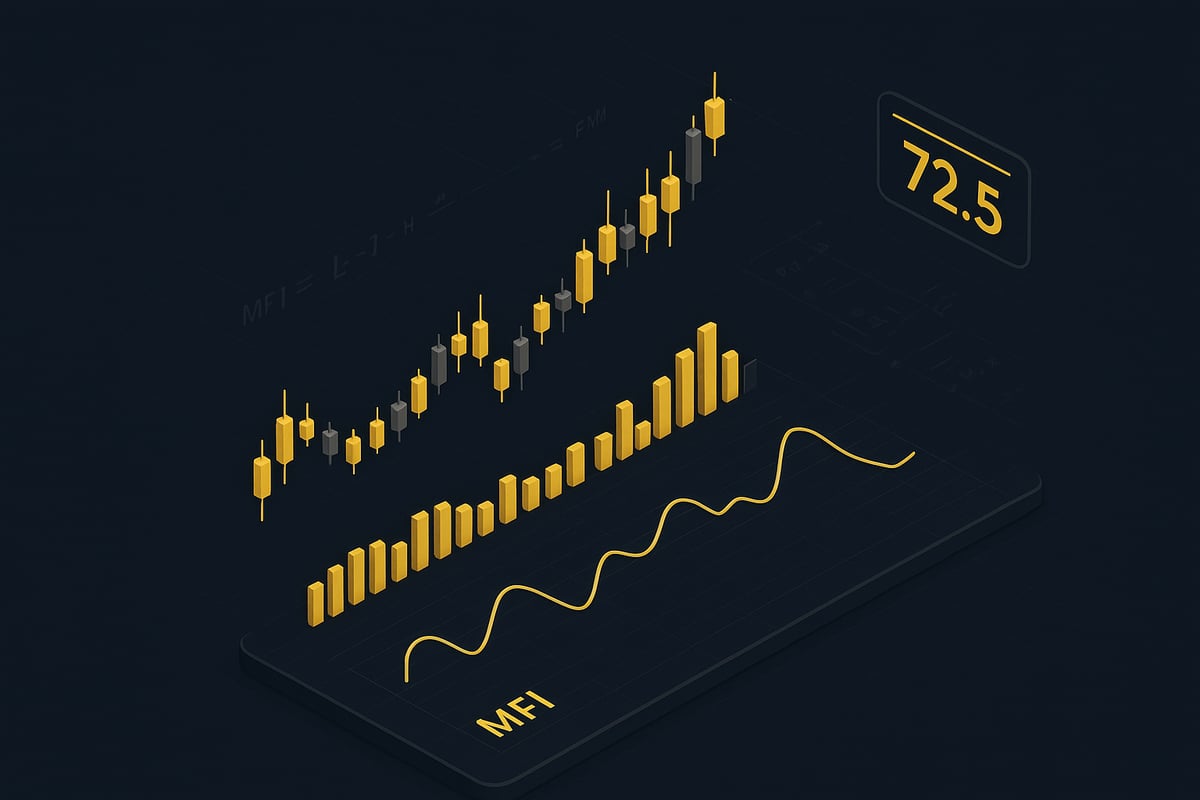
The MFI indicator is a volume-weighted oscillator designed to measure buying and selling pressure in a security. Unlike many commonly used oscillators, the MFI indicator integrates both price and volume, producing signals that often precede significant market moves.
A key difference between the MFI indicator and the Relative Strength Index (RSI) is that while RSI focuses solely on price momentum, the MFI indicator adds a critical layer by factoring in volume. This means the MFI indicator can reveal hidden shifts in market sentiment that price-only tools might miss. For a deeper comparison, you can review the Money Flow Index (MFI) Definition and Calculation, which outlines how MFI stands apart from other indicators.
Historically, the MFI indicator was developed in the 1980s by Gene Quong and Avrum Soudack. Since then, it has steadily gained popularity among professional analysts due to its reliability in volatile and high-volume environments.
Traders use the MFI indicator for several core purposes:
- Identifying overbought and oversold conditions
- Spotting early trend reversals
- Detecting market extremes before price reacts
A compelling argument for the MFI indicator’s value is that volume often leads price. This means shifts in money flow can signal a change in trend before it becomes apparent on the price chart. For example, during a rapid rally, the MFI indicator might show declining money flow even as price climbs, hinting at an impending reversal. Recent analyst surveys consistently rank the MFI indicator among the top choices for anticipating market turns, especially when compared with lagging indicators.
Core Components of MFI
To effectively apply the MFI indicator, it is crucial to understand its main building blocks. Each component contributes to the indicator’s unique ability to blend price and volume data.
1. Typical Price Calculation:
The MFI indicator starts by calculating the typical price for each period. This is done using the formula:
Typical Price = (High + Low + Close) / 3
This average price serves as the foundation for subsequent calculations.
2. Raw Money Flow:
Next, the typical price is multiplied by the period’s volume to determine raw money flow. The MFI indicator distinguishes between positive and negative flows based on whether the typical price increased or decreased versus the previous period.
3. Look-back Period:
The most common setting for the MFI indicator is a 14-period look-back, balancing sensitivity and reliability. Shorter periods make the indicator more responsive but may increase false signals, while longer periods smooth out the data.
4. Oscillator Range:
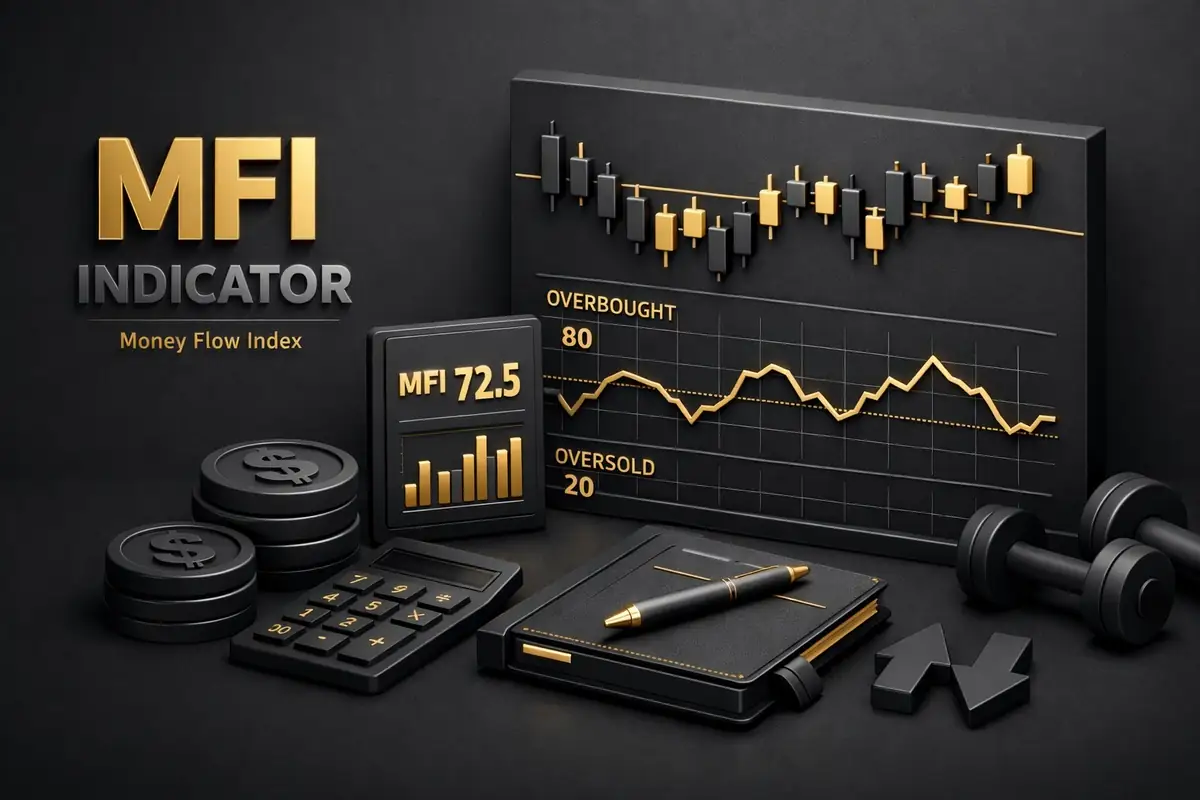
The MFI indicator oscillates between 0 and 100. Values above 80 typically signal overbought conditions, while readings below 20 indicate oversold markets. This clear range helps traders quickly assess the current market environment.
Example Scenario:
Imagine a volatile trading session where prices swing sharply. The MFI indicator would reflect these changes with pronounced peaks and troughs, often leading price reversals when extreme levels are reached. By monitoring these swings, traders can anticipate shifts in momentum with greater confidence.
Understanding these components enables you to harness the full potential of the MFI indicator, setting the stage for more advanced analysis and strategic application.
How to Calculate the MFI: Step-by-Step
Calculating the mfi indicator may seem complex at first, but breaking it down into clear steps makes the process approachable for any trader. This section will walk you through each calculation stage, blending practical formulas with real-world tips to ensure you can confidently use the mfi indicator in your analysis.

Step 1: Calculate Typical Price
Begin by finding the typical price for each period. The formula is simple:
Typical Price = (High + Low + Close) / 3For example, if a stock’s high is $110, low is $100, and close is $105, the typical price would be ($110 + $100 + $105) / 3 = $105.
This step is foundational because the mfi indicator uses typical price instead of just the closing value, capturing a more balanced view of daily price movement. Accurate typical price calculations help set the stage for precise money flow analysis.
Step 2: Determine Raw Money Flow
Next, multiply the typical price by the period’s volume to get the raw money flow:
Raw Money Flow = Typical Price * VolumeIf today’s typical price is $105 and volume is 10,000, raw money flow equals $1,050,000.
Now, classify each period as positive or negative money flow. If the typical price rises from the previous period, the flow is positive. If it drops, the flow is negative. This positive or negative classification is vital, as the mfi indicator distinguishes buying and selling pressure, making it different from price-only tools. For a deeper look at volume-based indicators, see Volume-Based Trading Indicators.
Step 3: Sum Positive and Negative Money Flows
Once you have raw money flows labeled, sum the positive and negative values over a standard 14-period window. For example, over 14 days:
| Day | Raw Money Flow | Positive | Negative |
|---|---|---|---|
| 1 | $1,050,000 | $1,050,000 | |
| 2 | $980,000 | $980,000 | |
| … | … | … | … |
Add all positive flows for the 14 days, then do the same for negative flows. This aggregation smooths out daily spikes, enabling the mfi indicator to reflect sustained buying or selling activity. Many traders use Excel or charting platforms to automate this step for efficiency.
Step 4: Calculate Money Flow Ratio and MFI Value
Now, calculate the money flow ratio:
Money Flow Ratio = Positive Money Flow / Negative Money FlowThen, apply the MFI formula:
MFI = 100 - [100 / (1 + Money Flow Ratio)]Suppose your 14-day positive flow is $8,000,000 and negative is $4,000,000. The ratio is 2, so MFI = 100 - [100 / (1 + 2)] = 66.67.
This formula is similar to the RSI but incorporates volume, giving the mfi indicator its unique predictive power. Walking through these calculations with real data ensures accurate, actionable results.
Step 5: Interpret the Result
Your final mfi indicator value will fall between 0 and 100. Values above 80 suggest an overbought market, while below 20 indicates oversold conditions.
For manual checks, a quick glance at your charting tool’s MFI output confirms your calculations. If you prefer quick math, use a calculator or spreadsheet to verify results. Consistent practice with the mfi indicator helps you spot signals faster and with greater confidence in live trading scenarios.
Interpreting MFI Signals for Trading Decisions
Navigating the complexities of today’s markets requires clarity when making trading decisions. The mfi indicator stands out for offering actionable signals that blend both price and volume, giving traders an informed edge. Understanding how to interpret these signals is essential for harnessing the full potential of the mfi indicator.

Overbought and Oversold Levels
One of the most widely recognized signals from the mfi indicator is when it enters overbought or oversold territory. Typically, readings above 80 are considered overbought, while values below 20 indicate oversold conditions. These thresholds often highlight moments when a reversal or trend exhaustion is likely.
For example, if the mfi indicator rises above 85, it may signal that buying pressure is peaking, suggesting a potential pullback. Conversely, a dip below 15 could point to excessive selling and an approaching rebound. Backtesting studies, such as those discussed in Investor Sentiment by Money Flow Index and Stock Return, reveal that MFI extremes frequently precede notable price corrections.
Key points to remember:
- Overbought (80+): Watch for reversal signals.
- Oversold (20-): Look for signs of trend exhaustion.
- Confirm signals with other indicators or price action.
While these levels do not guarantee immediate turns, combining them with additional analysis improves reliability.
Divergences and Failures
Divergences between price action and the mfi indicator can offer powerful early warnings of impending trend changes. A bullish divergence forms when price marks new lows, but the mfi indicator creates higher lows, suggesting underlying buying strength. In contrast, a bearish divergence arises when price reaches new highs while the mfi indicator shows lower highs, hinting at weakening momentum.
Failure swings are another valuable pattern. If the mfi indicator fails to reach a previous extreme, it often indicates that momentum is fading, and a reversal could be imminent. For example, in a high-volume stock in 2025, a bullish divergence alerted traders to a bottom before the share price rallied.
Traders should:
- Scan for divergences around overbought/oversold zones.
- Use failure swings as confirmation of trend shifts.
- Pair divergence signals with volume analysis for added confidence.
Volume Confirmation and False Signals
Volume is a critical element that sets the mfi indicator apart from price-only tools. By factoring in both price movement and volume, the mfi indicator helps filter out many false breakouts and misleading moves that can occur in thin or choppy markets.
Consider a scenario where the price appears to break out of a trading range, but the mfi indicator fails to confirm with a corresponding surge. This mismatch often warns that the breakout may lack conviction and is likely to reverse. Conversely, a strong move in both price and the mfi indicator provides more robust confirmation.
To avoid false signals:
- Always check if the mfi indicator aligns with price action.
- Be cautious of signals in low-volume environments.
- Cross-reference with other volume-based indicators for validation.
The mfi indicator’s integration of volume makes it a reliable filter for noise, especially during periods of market uncertainty.
Using MFI with Different Timeframes
The flexibility of the mfi indicator allows traders to tailor it to various trading styles and timeframes. While the standard 14-period setting works well for many, shorter periods (like 7) can provide quicker signals for day traders, and longer periods (such as 21) offer smoother trends for swing or position traders.
For example, on a 1-hour chart, the mfi indicator might highlight intraday reversals, while the same indicator on a daily chart could capture broader trend shifts. Traders often compare signals across multiple timeframes to align entries with the dominant trend.
Practical tips:
- Choose your timeframe based on your trading approach.
- Validate short-term signals with longer-term MFI trends.
- Adjust settings to match the volatility of your chosen asset.
By adapting the mfi indicator to your market and timeframe, you gain a nuanced perspective that supports more informed trading decisions.
Integrating MFI with Other Technical Analysis Tools
Pairing the mfi indicator with other technical analysis tools can elevate your trading accuracy. No single indicator provides a complete market picture, so integration is essential for filtering noise and boosting signal quality. Let’s explore how the mfi indicator pairs with top trading tools for 2026.
MFI and Relative Strength Index (RSI)
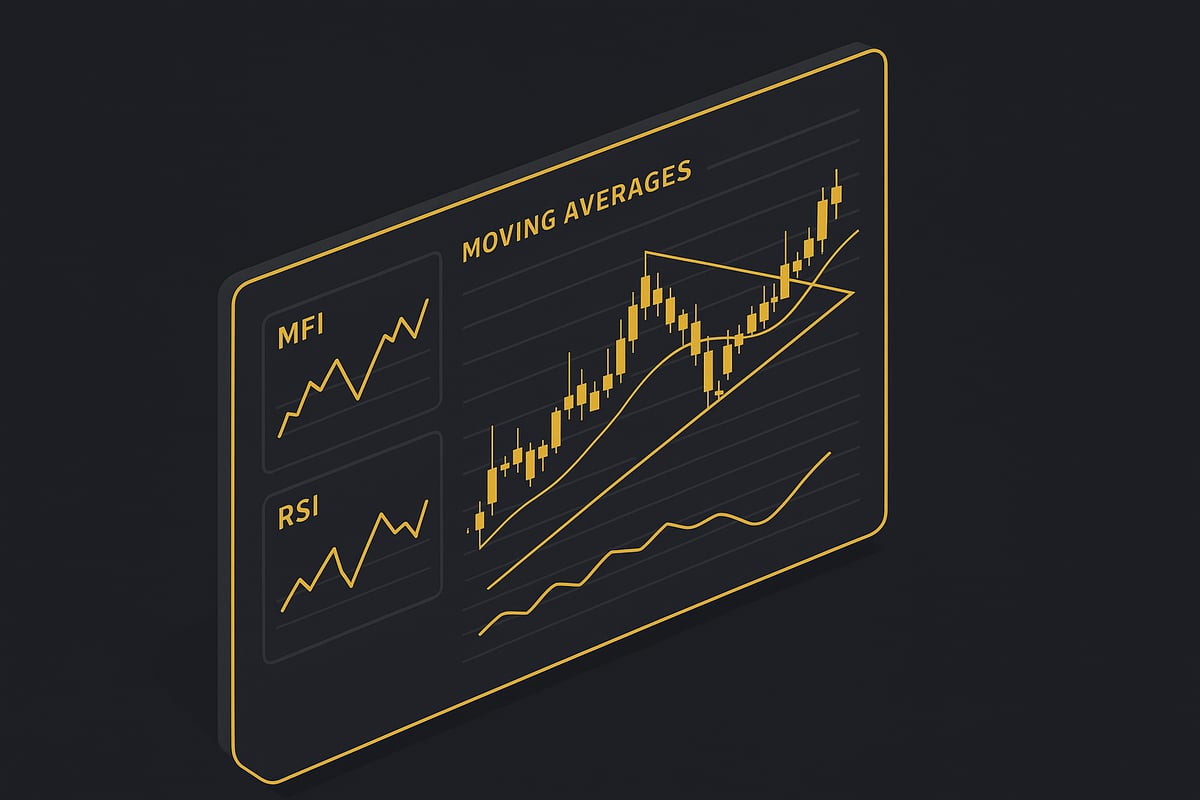
The mfi indicator and the Relative Strength Index (RSI) are often used side by side for stronger trade confirmations. While the mfi indicator incorporates volume into its calculations, RSI focuses solely on price momentum. By comparing both, traders can spot when volume supports a price move, reducing the risk of false signals.
For example, if both the mfi indicator and RSI signal overbought conditions, the probability of a reversal increases. This dual confirmation is especially valuable in volatile markets. Some traders rely on a table to track these overlaps:
| Signal | MFI | RSI | Strength |
|---|---|---|---|
| Overbought | Yes | Yes | Strong |
| Overbought | Yes | No | Moderate |
| Oversold | Yes | Yes | Strong |
To dig deeper into how these tools compare, check out this Best Technical Indicators for Trading resource for comprehensive insights.
MFI and Moving Averages
When you combine the mfi indicator with moving averages, you gain another layer of trend validation. Moving averages smooth out price data, revealing the underlying trend direction. If the mfi indicator signals an oversold condition just as price breaks above its 50-day moving average, it often marks a high-probability entry.
Consider a scenario where the mfi indicator crosses above 20, suggesting buyers are returning. If this occurs while the price closes above a key moving average, the confluence of signals can offer greater conviction. This approach helps filter out trades that lack broader market support.
Short-term traders may use faster moving averages, like the 10-day or 21-day, with the mfi indicator for quicker signals. Longer-term investors often stick to the 50-day or 200-day moving averages for confirmation.
MFI with Chart Patterns and Trendlines
Chart patterns and trendlines remain staples of technical analysis. The mfi indicator serves as a powerful confirmation tool for classic formations such as triangles, flags, or head and shoulders. When a breakout occurs, the mfi indicator can validate the move if it surges in the direction of the breakout.
For example, suppose a triangle pattern forms on a stock chart. As price breaks above the upper trendline, the mfi indicator spiking above 80 can confirm strong buying pressure. This reduces the likelihood of a false breakout and provides traders with more confidence in their setup.
Similarly, the mfi indicator helps spot breakdowns. If price falls below a support line, a rapid drop in the mfi indicator confirms sellers are in control, supporting a trade entry or exit decision.
Advantages and Limitations of MFI in Multi-Indicator Strategies
Integrating the mfi indicator with other tools brings both strengths and challenges. Its main advantage is providing early signals by tracking volume behind price moves. This volume context helps traders filter out market noise and avoid chasing weak trends.
However, the mfi indicator can lag in assets with low trading volume or produce false signals in choppy, sideways markets. It is crucial to avoid overreliance on the mfi indicator alone. Combining it with price action, trendlines, and other indicators increases the odds of success.
In summary, the mfi indicator excels when used as part of a broader toolkit. Always backtest your combinations and remain flexible, adapting strategies to different market environments.
Advanced Money Flow Analysis Techniques for 2026
Navigating the evolving landscape of financial markets in 2026 requires a forward-thinking approach to the mfi indicator. As trading becomes more influenced by algorithms, cross-asset volatility, and 24/7 digital markets, mastering advanced MFI techniques is essential for staying ahead.
Adapting MFI for New Market Conditions
Market microstructure is rapidly changing. In 2026, high-frequency trading and algorithmic strategies dominate, while crypto and emerging markets bring new liquidity patterns. The mfi indicator must be adapted for these shifts.
For crypto assets, consider shortening the MFI look-back period to 7 or 10 to capture rapid price and volume swings. Forex markets, with their unique session-driven volumes, may benefit from session-specific MFI calibrations. In emerging markets, adjust the indicator to account for sporadic volume spikes and thin liquidity.
Algorithmic traders often integrate the mfi indicator into automated systems, tweaking parameters to align with volatility and asset class. Staying flexible and recalibrating settings regularly is crucial for accurate money flow analysis.
Multi-Timeframe Money Flow Analysis
Analyzing the mfi indicator across multiple timeframes provides a broader market perspective. Using weekly, daily, and intraday MFI values helps confirm trend direction and identify optimal entry points.
For example, a trader might use the following table to align signals:
| Timeframe | MFI Value | Signal |
|---|---|---|
| Weekly | 75 | Overbought |
| Daily | 80 | Overbought |
| 1-Hour | 60 | Neutral |
If both weekly and daily charts show the mfi indicator in overbought territory, but intraday is neutral, consider waiting for short-term confirmation before acting. This systematic approach reduces false signals and sharpens decision-making.
Automated MFI Signal Generation and Alerts
Modern trading platforms offer tools for automating mfi indicator analysis. By setting up real-time alerts for specific MFI crossovers or extreme values, traders can react instantly to market shifts.
To automate, follow these steps:
- Choose a platform like TradingView.
- Set alert conditions for MFI values crossing above 80 (overbought) or below 20 (oversold).
- Integrate with your trading strategy for immediate action.
For more on automation, pitfalls, and best practices, review Money Flow Index (MFI) Trading Strategies, which covers advanced setups and risk controls.
Automating the mfi indicator ensures you never miss a critical signal, especially in fast-moving markets.
Case Study: MFI in High-Volume vs. Low-Volume Assets
The mfi indicator performs differently depending on asset liquidity. In high-volume stocks like those in the S&P 500, MFI signals are generally more reliable. In contrast, small-cap equities or thinly traded crypto pairs may generate more false positives due to erratic volume spikes.
Consider this comparison:
| Asset Type | Volume Level | MFI Reliability |
|---|---|---|
| S&P 500 Stock | High | High |
| Small-Cap Stock | Low | Moderate/Low |
| Major Crypto | High | High |
| Minor Crypto | Low | Low |
When using the mfi indicator in low-volume environments, always pair it with other confirmation tools to validate signals.
Common Pitfalls and How to Avoid Them
Traders can fall into traps by over-relying on the mfi indicator alone. Ignoring price context or trading during news-driven volume spikes can lead to losses.
To avoid common pitfalls:
- Always confirm MFI signals with trendlines, price patterns, or moving averages.
- Be wary of anomalies caused by earnings releases or macroeconomic news.
- Regularly review and adjust your MFI settings for each asset class.
Staying disciplined with the mfi indicator, and integrating it with a broader analysis toolkit, is key to long-term trading success.
Real-World MFI Trading Strategies and Examples
Unlocking the full potential of the mfi indicator requires practical strategies and real-world application. In this section, we break down proven trading methods, highlight asset-specific adaptations, and share actionable examples to help you master money flow analysis in live markets.
MFI Reversal Strategy
One of the most popular uses of the mfi indicator is catching market reversals at extremes. This approach relies on spotting overbought and oversold levels, typically above 80 or below 20.
Step-by-step guide:
- Watch for the mfi indicator to cross below 20 (oversold) or above 80 (overbought).
- Confirm with a candlestick reversal pattern or price action signal.
- Enter the trade with a stop-loss just beyond the recent swing low or high.
- Set a profit target at the next key resistance or support level.
For example, in a major forex pair, the mfi indicator dropped to 18 while price formed a double bottom. This confluence signaled a high-probability long entry, resulting in a swift rally as buying pressure returned.
MFI Trend Continuation Strategy
Beyond reversals, the mfi indicator excels at identifying trend continuation after temporary pullbacks. Traders often look for retracements where the MFI dips but remains above key thresholds, suggesting momentum is still intact.
How to execute:
- Identify a strong trend with higher highs and higher lows.
- Wait for the mfi indicator to pull back near 40 during an uptrend, or 60 in a downtrend.
- Enter when MFI rebounds, signaling renewed buying or selling interest.
A classic scenario: After an initial surge, a stock’s mfi indicator dipped to 40, then rebounded as volume increased. This provided an optimal entry point, allowing traders to ride the next leg of the bullish move.
MFI Divergence Strategy
Divergences between price and the mfi indicator can foreshadow significant market moves. A bullish divergence occurs when price makes new lows but MFI forms higher lows, hinting at waning selling pressure. Conversely, bearish divergence arises when price hits new highs but MFI prints lower highs.
Practical steps:
- Spot divergence by comparing price swings to corresponding MFI swings.
- Confirm with other indicators or chart patterns for higher accuracy.
- Enter trades as soon as divergence is validated by a reversal bar.
Consider a tech stock prior to earnings: price dropped to fresh lows, but the mfi indicator formed a series of higher lows. This hidden divergence signaled accumulation and a sharp post-earnings breakout. For further comparison of MFI with similar tools, see the RSI vs MFI Comparison.
Customizing MFI Strategies for Asset Classes
The mfi indicator adapts well across stocks, crypto, and indices, but each market class has unique traits. For stocks, MFI can be paired with earnings volume spikes to catch institutional moves. In crypto, where volatility is higher, traders often use shorter look-back periods for quicker signals. When trading indices or ETFs, MFI helps identify sector rotation and swing trading opportunities.
Example strategy:
- For ETFs, use the mfi indicator to spot sector inflows by monitoring MFI surges above 80.
- Rotate capital into sectors showing strong MFI and price alignment.
To further deepen your understanding of volume-based analysis, explore the Accumulation and Distribution Indicator Guide, which complements MFI strategies by highlighting accumulation phases and distribution events.
Backtesting and Performance Metrics
Before deploying any mfi indicator strategy, rigorous backtesting is essential. Modern platforms like TradingView and StockCharts enable traders to validate strategies across historical data.
Key backtesting metrics:
| Metric | Description |
|---|---|
| Win Rate | Percentage of profitable trades |
| Risk/Reward Ratio | Average profit versus average loss |
| Maximum Drawdown | Largest equity drop during testing |
| Sharpe Ratio | Risk-adjusted return |
Recent competitor backtesting shows that mfi indicator-based strategies can achieve win rates above 55 percent with proper risk management, especially when combined with confirmation tools and strict stop-loss placement. Always tailor your approach based on your trading style and market conditions.
Best Practices and Tips for Mastering MFI in 2026
Mastering the mfi indicator in 2026 requires a blend of technical skill, adaptability, and a solid understanding of evolving markets. To help you stay ahead, here are essential best practices, expert tips, and resources for leveraging this powerful tool effectively.
Optimizing MFI Settings for Your Trading Style
The mfi indicator is not a one-size-fits-all tool. Adjust your settings based on your trading style and the volatility of your chosen asset class. For instance, day traders may reduce the typical 14-period look-back to 10 for faster signals, while long-term investors might prefer 21 periods for smoother trends.
When trading highly volatile markets like crypto, shorter periods can help capture quick reversals, but they may also increase noise. In contrast, longer periods filter out minor fluctuations and highlight dominant trends in stocks or indices. Test different settings and backtest your approach regularly to ensure the mfi indicator aligns with your risk tolerance and objectives.
Combining MFI with Fundamental Analysis
While the mfi indicator excels at highlighting shifts in buying and selling pressure, pairing it with fundamental analysis can provide a more complete market view. For example, strong earnings reports or macroeconomic news can validate signals from the mfi indicator, increasing your confidence in a trade.
Investor behavior often drives volume surges, making sentiment analysis crucial. Research such as Measuring Investor Sentiment with Mutual Fund Flows demonstrates how fund flows can reveal underlying market sentiment, which complements volume-based indicators like the mfi indicator. By integrating both technical and fundamental perspectives, you can make more informed decisions.
Risk Management with MFI
Effective risk management is vital when using the mfi indicator. Always set clear stop-loss and take-profit levels based on mfi signals and price action. For example, if the mfi indicator exits an oversold zone and returns to neutral, consider tightening stops to protect gains or minimize losses.
Avoid overtrading by filtering out weak setups, and never rely solely on the mfi indicator for entries. Use it alongside other signals and confirm trades with price structure. Remember, even the best indicators can produce false signals, especially in low-volume or choppy markets.
Continuous Learning and Adapting
Staying ahead with the mfi indicator means embracing ongoing education. Markets in 2026 will evolve, with new trading technologies and research emerging rapidly. Participate in trading forums, join webinars, and study real-time case studies to refine your technique.
Regularly review your trades and learn from both successes and mistakes. Adapt your strategies as market conditions shift, and remain open to updating your mfi indicator settings or integrating new analytical tools. Commitment to growth is key to long-term success.
Tools and Resources for MFI Mastery
Choose reliable charting platforms that support advanced mfi indicator analysis, such as TradingView or StockCharts. These tools offer customizable settings, real-time alerts, and backtesting features to enhance your workflow.
Supplement your learning with educational resources like books, online courses, and webinars focused on volume-based analysis. Practice calculating the mfi indicator manually using downloadable spreadsheets to solidify your understanding. Building a robust toolkit will help you confidently apply the mfi indicator across asset classes in 2026.
Now that you have a clear understanding of how the Money Flow Index can uncover valuable market trends and boost your trading decisions in 2026, it is time to put your knowledge into practice. Imagine having real-time, adaptive buy and sell signals at your fingertips, no more second guessing or missed opportunities. With PipTrend, you can simplify your trading process and gain the confidence to act on MFI insights across forex, crypto, stocks, and indices. Ready to see the difference for yourself
See Your Trading Improve With PipTrend
Risk Disclaimer: Trading involves risk. Past performance doesn't guarantee future results. Only trade with money you can afford to lose. PipTrend is a tool to assist your trading decisions, not financial advice.