EMA Indicator Guide: Master Trends in 2026 Markets
On this page
Are you prepared to master market trends in 2026? In today’s fast-moving markets, having a reliable tool is crucial. The ema indicator stands out as your secret weapon for staying ahead of the curve.
As volatility increases, traders need proven methods to detect trends and identify dynamic support or resistance. Mastering the ema indicator can help you boost trading accuracy, build confidence, and maximize profits.
This comprehensive guide will break down the fundamentals of the ema indicator, reveal advanced strategies, and provide actionable steps tailored for 2026 markets. We’ll cover everything from EMA basics and calculation to real-world examples and expert tips, empowering you to dominate trends as a next-generation trader.
Understanding the EMA Indicator: Core Concepts and Benefits
The ema indicator stands out as an essential tool for traders seeking to navigate fast-paced markets. Its ability to reflect price action quickly makes it a favorite among professionals and retail traders alike. Understanding its core concepts and benefits is the foundation for mastering trend analysis and technical strategies.
What is the EMA?
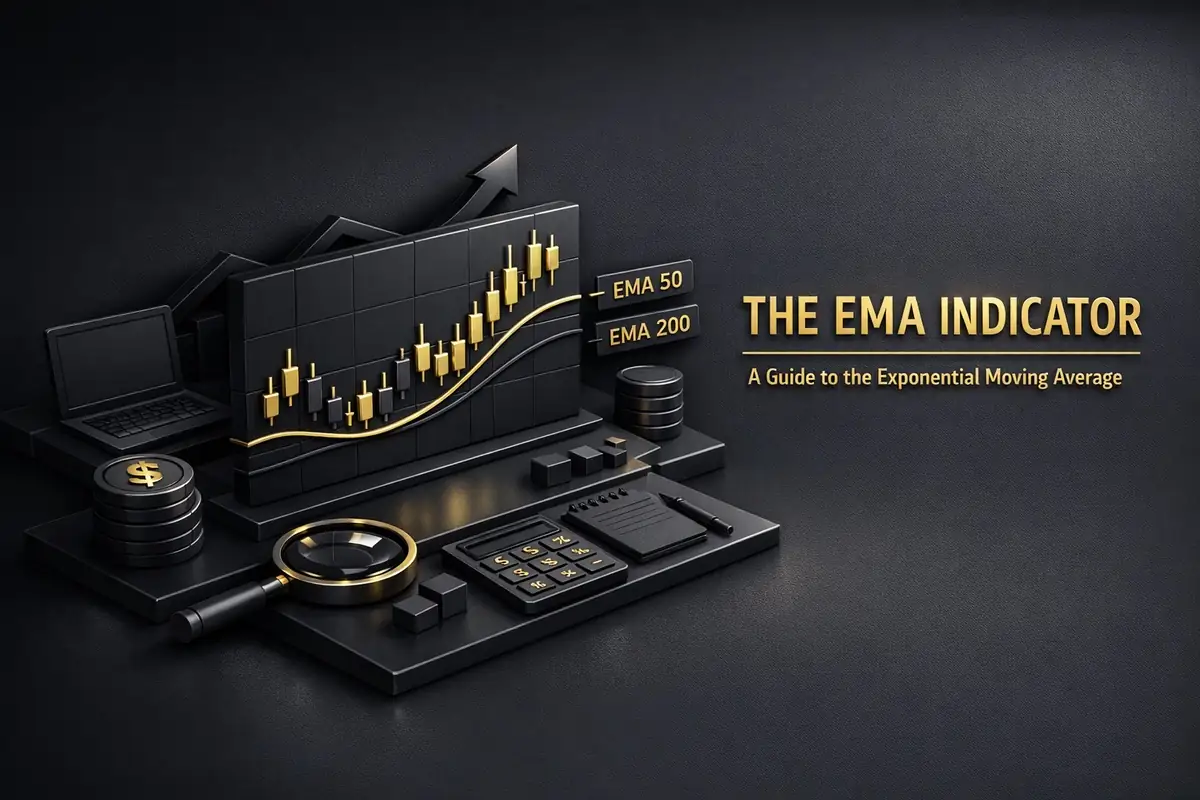
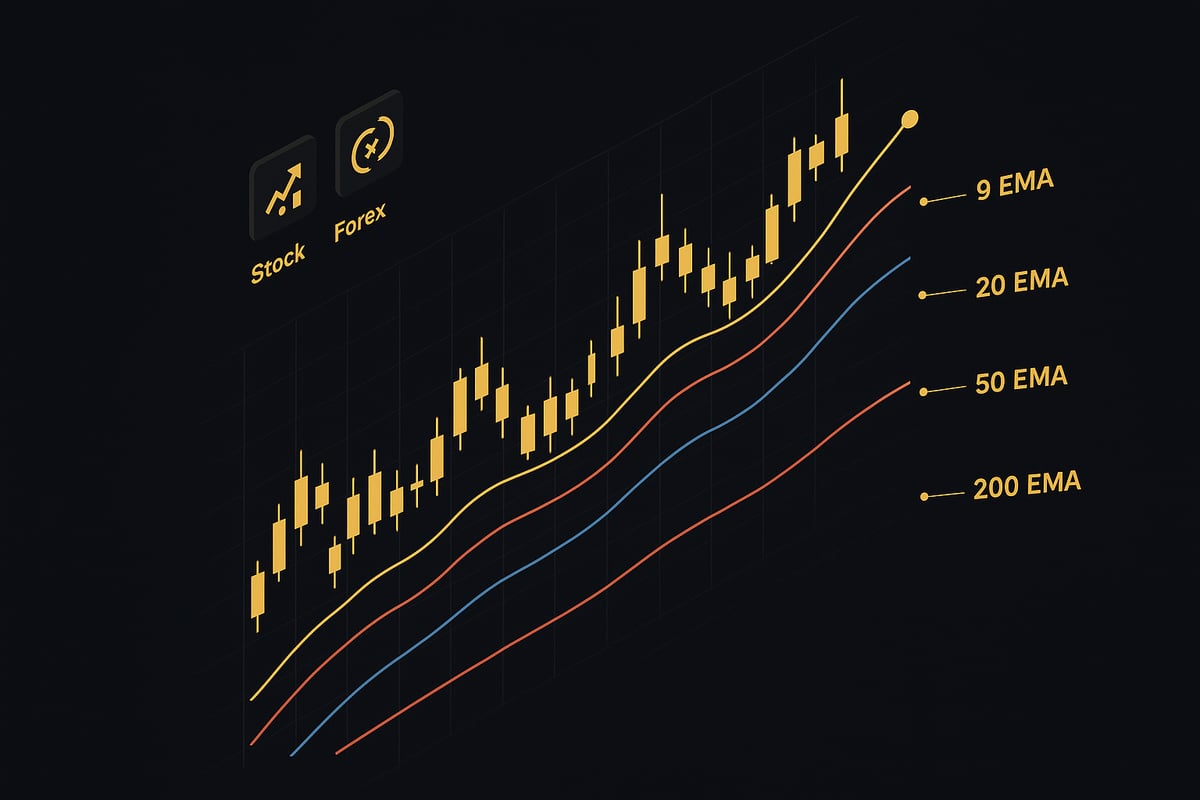
The Exponential Moving Average, or EMA, is a type of moving average that places more weight on the most recent price data. Unlike the Simple Moving Average, which weights all prices equally, the ema indicator adjusts more rapidly to market changes. This responsiveness helps traders capture shifts in sentiment as they occur.
Traders typically use common EMA periods such as 9, 20, 50, and 200 to analyze trends over different timeframes. For example, on a trending chart, an EMA(20) will hug the price action more closely than an SMA(20), providing earlier signals of momentum shifts.
The ema indicator excels at showing real-time market sentiment, giving traders an edge in active markets. To see how EMA fits into the broader landscape of technical tools, visit the Technical Indicators in Trading resource.
Why EMA Matters in 2026 Markets
As we approach 2026, financial markets are expected to become even more volatile with the rise of algorithmic trading and rapid news cycles. Speed and adaptability will be crucial for traders who want to stay competitive. The ema indicator is specifically designed to filter out market “noise,” helping traders focus on genuine trend signals rather than random price fluctuations.
In fast-moving assets, EMA acts as a dynamic support or resistance level. For instance, during sudden news-driven moves, prices often react sharply to key EMA levels before resuming their trend. Professional traders frequently highlight the ema indicator’s value for its ability to adapt quickly and provide actionable information in both calm and turbulent conditions.
Key Advantages of EMA for Traders
The ema indicator offers several compelling benefits for modern traders:
- Faster reaction to price changes compared to SMA
- Improved entry and exit timing for swing and day traders
- Versatility across forex, stocks, crypto, and indices
- Multi-timeframe compatibility for deeper trend analysis
- Seamless integration with other indicators
By combining different EMAs, such as a short-term and a long-term average, traders can confirm trend reversals or continuations. For example, an EMA crossover strategy can help identify when to enter or exit trades, boosting accuracy and confidence in decision-making.
EMA vs. Other Moving Averages
When comparing the ema indicator to other moving averages, several distinctions emerge. EMA responds more rapidly to price changes than the Simple Moving Average, which can lag in volatile conditions. The Weighted Moving Average (WMA) also emphasizes recent data but uses a linear weighting, making it less responsive than EMA in some cases.
| Feature | EMA | SMA | WMA |
|---|---|---|---|
| Reacts Quickly | Yes | No | Somewhat |
| Weights Recent Data | Exponentially | Evenly | Linearly |
| Lag | Low | High | Medium |
The ema indicator is often preferred by active traders who require timely signals, especially in choppy or fast-moving markets. For instance, in a volatile trading session, EMA can outperform SMA by reducing lag and providing clearer trend signals. However, for long-term investors or those trading in stable environments, SMA or WMA may sometimes be sufficient. Choosing the right average depends on your strategy, asset class, and risk tolerance.
How the EMA is Calculated and Interpreted
Understanding how the ema indicator is calculated and interpreted is essential for every trader aiming for precision. The following subsections break down the process, platform integration, signal reading, and common pitfalls, giving you a practical roadmap for mastering EMA in your trading journey.
The EMA Formula Demystified
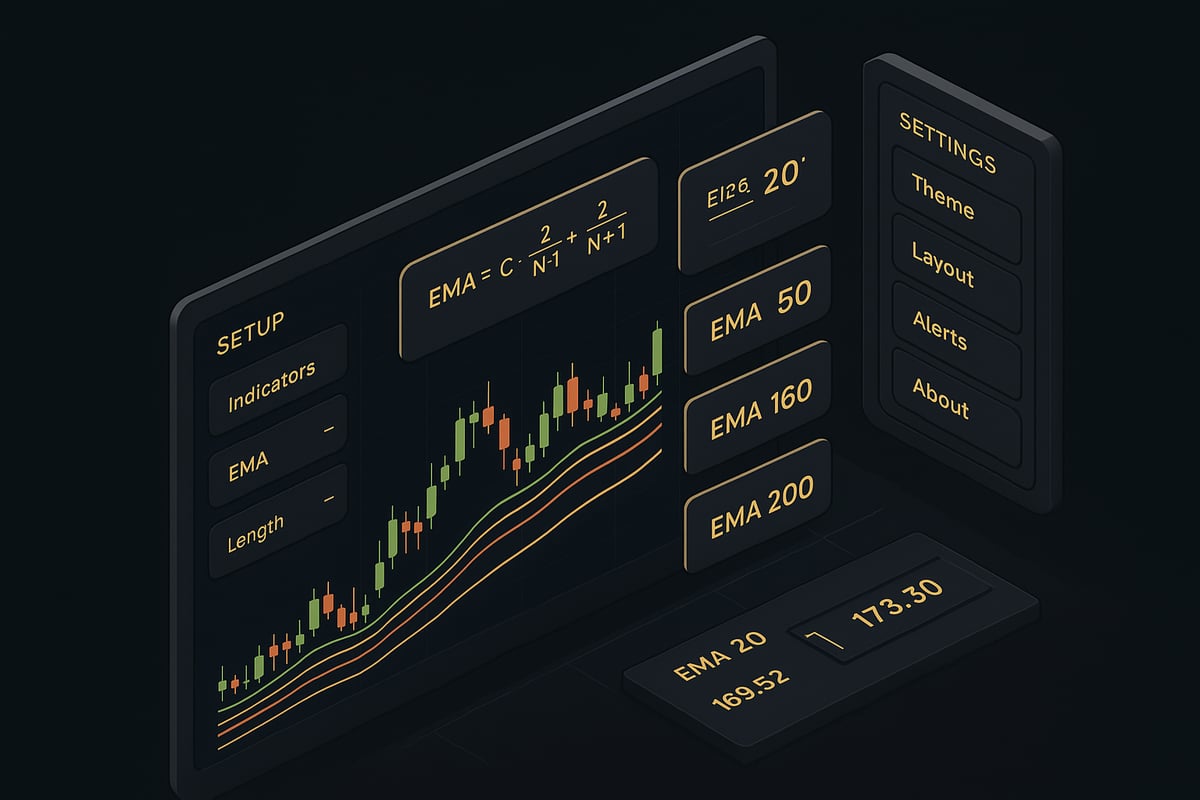
The ema indicator uses a unique formula that emphasizes recent price data, making it more responsive to current trends than other moving averages. The EMA calculation is:
EMA = (Price_today × Multiplier) + (EMA_yesterday × (1 - Multiplier))
Multiplier = 2 / (N + 1)
Here, “N” is the selected period (e.g., 20 for EMA(20)). By weighting recent prices more heavily, the EMA quickly reflects real-time market sentiment. For example, if you compare EMA(20) and SMA(20) on a trending chart, the EMA will hug price action more closely.
Understanding this formula is crucial, as it helps traders avoid misconceptions and overreliance on the ema indicator. For further analytical insights on EMA’s trend-following effectiveness, see Following a Trend with an Exponential Moving Average: Analytical Results for a Gaussian Model.
Setting Up EMA on Popular Trading Platforms
Adding the ema indicator to your trading platform is straightforward. Most platforms, such as TradingView and MetaTrader, offer EMA as a default indicator. To set up:
- Open your chart and select “Indicators.”
- Search for “Exponential Moving Average” or “EMA.”
- Input your preferred period (e.g., 20, 50, 200).
- Customize the color and thickness for clarity.
You can overlay multiple EMAs for different timeframes to enhance analysis. For example, using a short-term EMA(9) and a long-term EMA(50) together can clarify market direction. Multi-EMA setups help traders spot shifts in momentum, making the ema indicator versatile for different strategies.
Interpreting EMA Signals
Reading ema indicator signals involves observing the slope and interaction with price. A rising EMA line signals bullish momentum, while a falling EMA suggests bearish conditions. The EMA often acts as dynamic support or resistance, with price frequently bouncing off it during strong trends.
Watch for price crossing above or below the EMA, these events can indicate potential entries or exits. EMA crossovers, such as when a short EMA moves above a longer EMA, often signal trend reversals or confirmations. For instance, an EMA(50) providing support in an uptrend is a classic bullish sign, helping traders make timely decisions with the ema indicator.
Common Pitfalls in EMA Interpretation
Despite its strengths, the ema indicator can mislead if not used carefully. One major pitfall is overfitting EMA periods to past performance, which may not work in future conditions. During sideways or consolidating markets, EMAs can generate false signals, causing traders to enter premature trades.
Short EMAs can lead to “chasing” price, resulting in whipsaws and increased trading costs. To reduce noise, avoid relying solely on the ema indicator in low-volume environments, where fake-outs are common. Always combine EMA signals with broader market context and other tools to enhance reliability and minimize losses.
EMA Trading Strategies for 2026: Step-by-Step Blueprint
Unlocking the full power of the ema indicator requires a methodical approach. Whether you are a day trader, swing trader, or investor, mastering EMA strategies can give you an edge in 2026’s dynamic markets. Below, we break down the essential blueprints to help you apply the ema indicator with confidence and precision.
Choosing the Right EMA Periods for Your Market
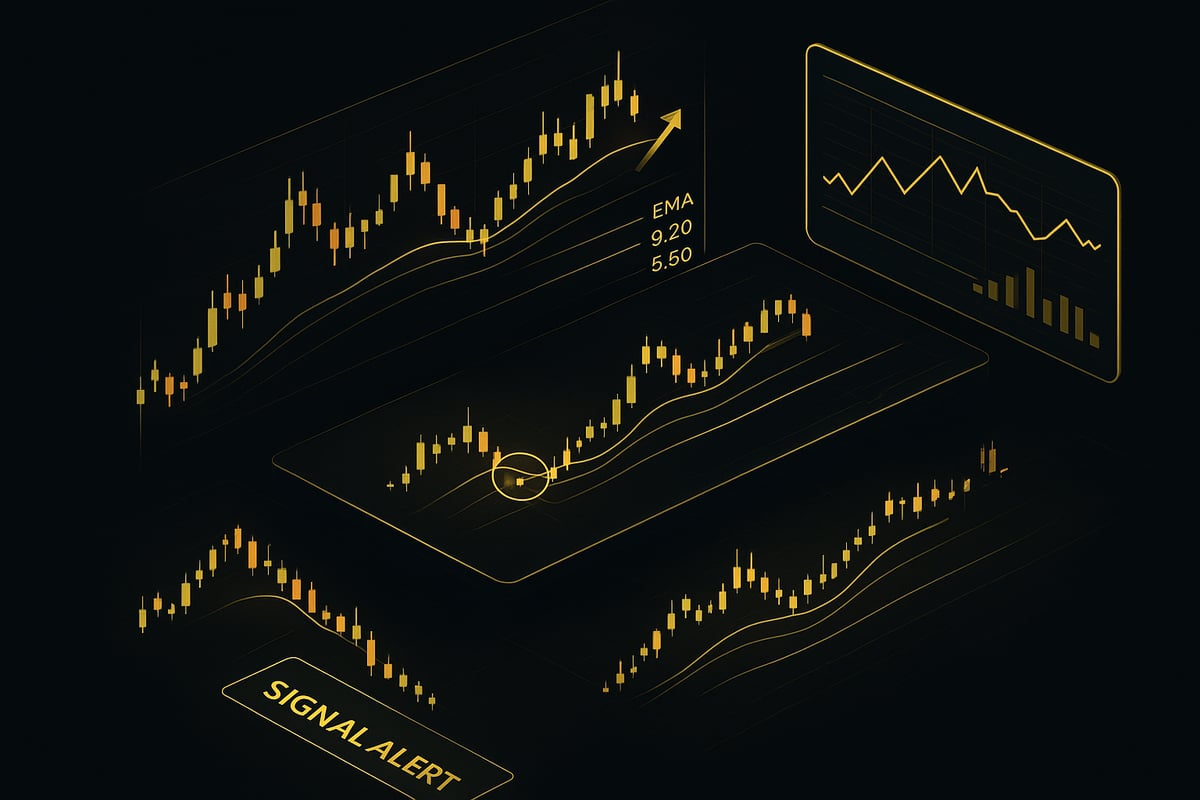
Selecting the optimal EMA period is a crucial first step for any trader using the ema indicator. Short-term EMAs, such as 9, 12, or 20, are ideal for fast-moving markets and scalping strategies. Longer EMAs, like 50, 100, or 200, help investors identify broader trends and key support levels.
The ema indicator adapts to your trading style. Day traders often favor EMAs between 9 and 21, while swing traders might use 20 or 50. For high-volatility assets in 2026, adjusting your EMA settings based on asset class, crypto, forex, or stocks, is vital. For example, crypto traders may benefit from shorter EMAs due to 24/7 price action, while forex traders might use 20/50 EMAs for news-driven environments.
Popular settings among top traders include EMA(9) for momentum and EMA(200) for long-term trend confirmation. Always backtest your chosen periods to ensure they fit your market conditions.
The EMA Crossover Strategy Explained
One of the most popular uses of the ema indicator is the crossover strategy. This method involves plotting two EMAs, one fast (e.g., 9) and one slow (e.g., 21)-on your chart. A bullish crossover occurs when the fast EMA moves above the slow EMA, signaling a potential buy. Conversely, a bearish crossover signals a sell.
To enhance reliability, traders often combine EMA crossovers with volume spikes or price action signals. For example, a 9/21 EMA crossover, confirmed by a breakout candle, can provide a high-probability entry in a trending stock.
Filtering out false signals is essential. Consider waiting for additional confirmation before entering a trade based solely on an ema indicator crossover. This approach helps reduce whipsaws and improves overall trade accuracy.
EMA as Dynamic Support and Resistance
The ema indicator serves as a dynamic support and resistance tool. When an asset is trending, price frequently “bounces” off key EMA levels, such as the 20 or 50 period. These bounces provide traders with potential entry points during established trends.
Look for “flips,” where the EMA shifts from support to resistance or vice versa, indicating a possible trend reversal. EMA clusters, where multiple EMAs converge, often highlight high-probability trade zones.
For stop-loss placement, consider setting your stop just beyond the EMA level. Take-profit targets can be aligned with the next significant EMA or historical price structure. This disciplined approach helps manage risk while maximizing rewards with the ema indicator.
Multi-Timeframe EMA Analysis
Analyzing the ema indicator across several timeframes provides a more comprehensive view of market trends. By aligning short, medium, and long EMAs on different charts, you can confirm the dominant trend and reduce the risk of counter-trend trades.
For instance, a day trader might use the 5/20 EMA on the 15-minute chart, then check the 1-hour EMA for overall direction. Multi-timeframe analysis helps filter out noise and increases signal reliability.
To dive deeper into this approach, explore Multi-Timeframe Trading Strategies for practical guidance on applying the ema indicator for trend confirmation and trade alignment. This method is proven to reduce false signals and improve consistency.
Combining EMA with Other Indicators
The ema indicator becomes even more powerful when used alongside other technical tools. Pairing EMA with the Relative Strength Index (RSI) helps confirm momentum, while combining EMA with MACD can signal trend strength and reversals.
Price action, such as candlestick patterns, can provide additional confirmation when trading near EMA levels. In volatile markets, some traders use EMA and stochastic indicators together for a more nuanced signal.
However, avoid indicator overload. Focus on a few complementary tools to support your ema indicator strategy, rather than crowding your chart with conflicting signals.
Risk Management When Trading EMA Strategies
Effective risk management is essential when using the ema indicator. Set your stop-loss based on the distance from the EMA, ensuring you allow for normal price fluctuations without risking excessive capital.
Consider position sizing and trailing stops that adjust as the EMA moves in your favor. This dynamic approach helps lock in profits and protect against sharp reversals.
Avoid overtrading by being selective with ema indicator signals. Not every crossover or bounce warrants a trade. Calculate your risk/reward ratio before each entry, and stick to your trading plan. EMA strategies with robust risk controls consistently outperform those that trade every signal indiscriminately.
Real-World EMA Applications: Case Studies and Market Examples
The practical power of the ema indicator comes alive when applied to real trading situations. From forex and crypto to stocks and algorithmic systems, traders leverage EMA to adapt to rapidly changing markets. Explore these case studies to see how the ema indicator shapes real-world decisions and results.

EMA in Forex Markets: 2026 Scenarios
In 2026, the forex landscape is more volatile than ever. Top traders rely on the ema indicator to capture trends in pairs like EUR/USD. By overlaying EMA(20) and EMA(50) on their charts, they can spot early entries during news-driven moves. When major economic reports hit, price often reacts sharply, but EMA lines help filter the noise and confirm genuine momentum.
A simple table illustrates how the ema indicator outperforms lagging tools:
| Scenario | SMA(20) | EMA(20) |
|---|---|---|
| News Spike | Lags | Reacts |
| Trend Start | Slow | Fast |
| Choppy Market | Whipsaw | Filters |
Backtests confirm that the ema indicator provides timely signals for both swing and day traders in the forex arena.
EMA for Crypto Trading: Navigating Volatility
The crypto markets, known for extreme price swings, demand tools that keep pace. The ema indicator stands out by offering dynamic support and resistance in fast markets like BTC, ETH, and DeFi tokens. Traders often use EMA(12/26) crossovers to ride the early stages of Bitcoin bull runs or to spot reversals during corrections.
For those navigating bear markets, enhanced EMA strategies, such as those described in the Enhanced Moving Average Strategy for Cryptocurrency Bear Markets, combine the ema indicator with disciplined stop-losses for improved risk management. This approach helps crypto traders maintain discipline even when markets turn unpredictable.
EMA in Stock and Index Markets
Equity and index traders frequently turn to the ema indicator for both short-term swings and longer-term trend confirmations. The classic EMA(50/200) “Golden Cross” signals bullish momentum, while the “Death Cross” warns of potential downturns. For instance, the S&P 500 often respects the EMA(200) as a dynamic support during major trends.
Swing traders monitor ema indicator crossovers on daily charts to time entries and exits, while position traders rely on longer EMAs to gauge the prevailing market bias. Studies show that the ema indicator increases the probability of catching sustained moves in both individual stocks and broader indices.
EMA and Algorithmic Trading in 2026
Algorithmic trading systems and AI-driven bots have embraced the ema indicator for its adaptability and speed. Many quantitative funds use EMA-based strategies to trigger high-frequency trades, capitalizing on small but consistent edge. A recent study, Technical Analysis Meets Machine Learning: Bitcoin Evidence, highlights how integrating the ema indicator with machine learning models can boost trading performance in assets like Bitcoin.
These systems analyze ema indicator crossovers in real time, filtering out false signals and executing trades in milliseconds. The result is a powerful synergy between traditional technical analysis and advanced automation.
Adapting EMA to Market Regimes
Markets do not always trend. Recognizing when the ema indicator is most effective is crucial for success. During strong uptrends or downtrends, the EMA provides reliable signals and dynamic zones for entries and exits. However, in ranging or consolidating markets, EMA lines often “flatline,” and signals become less trustworthy.
Astute traders adjust their ema indicator settings based on volatility and market regime. For example, shortening the EMA period in trending conditions and lengthening it during choppy phases helps reduce whipsaws and false alerts. Flexibility is key to maintaining an edge.
Lessons from EMA Failures: What to Avoid
No trading tool is infallible, and the ema indicator is no exception. In sideways markets, EMA signals can produce frequent whipsaws, leading to losses. Common mistakes include over-optimizing EMA periods for past data or relying solely on EMA without confirmation from other tools.
To recover from setbacks, traders should review their ema indicator trades, identify patterns of failure, and incorporate filters like volume or price action. Remember, the ema indicator works best as part of a broader strategy, not as a standalone solution. Learn from mistakes and evolve your approach for long-term success.
Advanced EMA Techniques and Future Trends
Staying ahead in trading means evolving with the markets. As we approach 2026, advanced strategies for the ema indicator are taking center stage. Let us explore the latest innovations, practical applications, and expert insights to future-proof your trading edge.
Adaptive and Variable EMAs
Markets are more dynamic than ever, and the ema indicator must keep pace. Adaptive EMAs, such as the Kaufman Adaptive Moving Average (KAMA) and Double Exponential Moving Average (DEMA), adjust their sensitivity based on volatility. This means they smooth out noise in sideways markets but react swiftly during strong trends.
| Type | Reactivity | Best Use Case |
|---|---|---|
| Standard EMA | Medium | Trending markets |
| KAMA | High | Choppy environments |
| DEMA | Very High | Fast-moving assets |
For traders who want a deeper understanding of how adaptive EMAs can be mathematically modeled and optimized, A Mathematical Analysis of Technical Analysis provides valuable insights. Understanding these options allows you to tailor the ema indicator for any market regime.
EMA in Multi-Asset Portfolios
Applying the ema indicator across forex, crypto, stocks, and indices creates a unified framework for trend analysis. You can use EMA signals to rotate capital between assets or to rebalance your portfolio based on confirmed trends.
For example, a portfolio manager might use EMA(50) crossovers to shift allocations between sectors or asset classes. This approach leverages the ema indicator’s versatility and helps traders capture opportunities as they arise in different markets.
EMA and Adaptive Trading Tools
Artificial intelligence is revolutionizing how traders use the ema indicator. AI algorithms can scan thousands of charts, filter false signals, and adapt EMA settings in real time. This boosts signal accuracy and minimizes lag.
adaptive models often combine the ema indicator with other technical factors, adjusting parameters dynamically as market conditions change. This synergy of machine learning and technical analysis is setting new standards for precision and speed in trading.
Adaptive EMA Trading with PipTrend
PipTrend’s adaptive platform is redefining how traders utilize the ema indicator. With real-time, actionable EMA-based buy and sell signals, PipTrend harnesses multi-timeframe EMA analysis to align trends and reduce false signals.
The platform offers instant alerts and customizable settings for any market, including forex, crypto, stocks, and indices. Proven user results show increased win rates and reduced overtrading. Seamless TradingView integration and a user-friendly interface make mastering the ema indicator in 2026 accessible for every trader.
EMA Optimization for 2026 Market Conditions
Volatility and liquidity are rising, so optimizing the ema indicator is crucial. Traders should regularly backtest different EMA periods and settings, especially when exploring new asset classes like tokenized assets.
An example: in AI-driven markets, shorter EMAs may capture quick moves, while longer EMAs filter out noise. Fine-tuning your ema indicator ensures it remains effective as market structures evolve. For broader context on how EMA fits within overall indicator strategy, the Trading Indicator Guide offers a comprehensive overview.
Expert Tips for EMA Mastery
To truly master the ema indicator, learn from professionals. Keep a detailed trading journal, review your EMA setups, and stay updated on research and software innovations. Build a personalized EMA playbook tailored to your style and markets.
Consider combining EMAs with other indicators and regularly refine your approach. Continuous education and disciplined practice will help you maximize the ema indicator’s value in the years ahead.
Now that you have a solid understanding of how the EMA indicator can transform your approach to fast-moving markets in 2026, it’s time to put your knowledge into practice. With PipTrend’s adaptive signals and multi-timeframe EMA analysis, you can trade with greater clarity, confidence, and consistency, no more second-guessing your entries or exits. Whether you’re focused on forex, crypto, stocks, or indices, PipTrend is designed to help you spot trends early and maximize your results. Ready to elevate your trading and start making smarter moves today?
See Your Trading Improve With PipTrend
Risk Disclaimer: Trading involves risk. Past performance doesn't guarantee future results. Only trade with money you can afford to lose. PipTrend is a tool to assist your trading decisions, not financial advice.